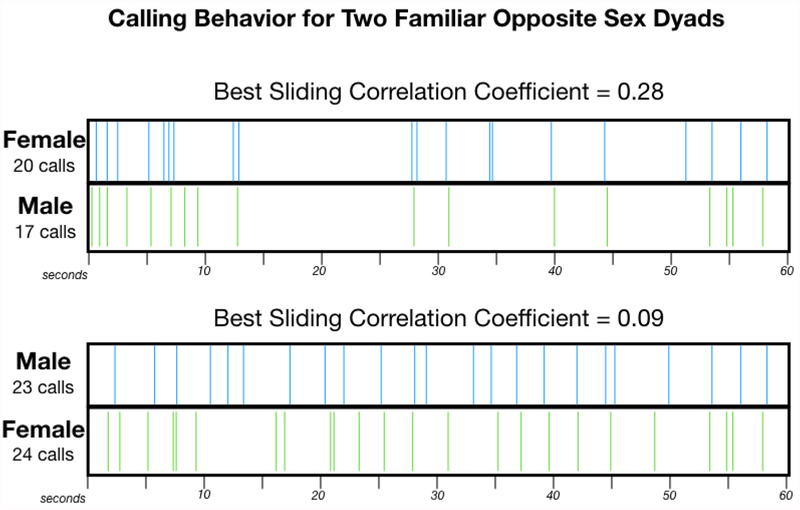
Figure 4:
Calling exchanges over the course of 1 minute are illustrated for two different Familiar Opposite-Sex Dyads. The corresponding sliding correlation coefficient is given. The top panel displays calling activity for a dyad with a relatively high sliding correlation coefficient, and bottom panel shows calling activity for a dyad with a lower sliding correlation coefficient. For each panel, the blue tick marks represent the onset of calls on channel 1 and the green tick marks represent the onset of calls on channel 2. These two example recordings were chosen because both individuals from each dyad called a lot. Thus, it is easier to visualize how the sliding correlation coefficient relates to variation in the pattern of calling behavior. Of particular note, the dyad represented in the top panel had organized calling bursts together and had longer periods of silence.

