Figure 3.
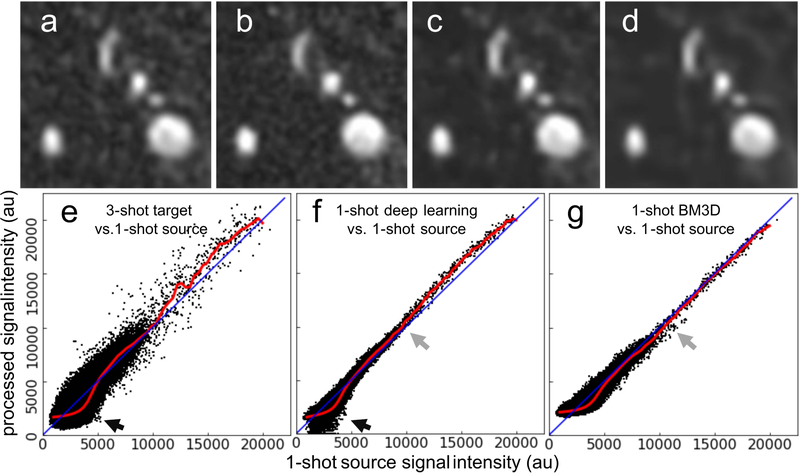
Comparison of image quality obtained with deep learning-based processing and BM3D denoising. Montage showing cropped source slices through the proximal left carotid artery obtained (a) with a 1-shot acquisition, (b) the target corresponding 3-shot image, (c) the deep learning processed 1-shot image, and (d) the BM3D denoised 1-shot image. Note the improved arterial-to-background contrast obtained with (c) deep learning-based processing with respect to (a). Scatter plots showing original input 1-shot voxel signal intensities over the entire field-of-view versus (e) the 3-shot target signal intensities, and the 1-shot signal intensities obtained with (f) deep learning image processing and (g) BM3D denoising. Red lines show the moving median trendlines of output signal intensity levels across the input signal intensity spectrum; lines of unity are shown in blue. Compared to BM3D denoising, deep learning processing provided a median trendline that more closely mimicked that of the reference 1-shot to 3-shot transformation shown in (e), by selectively suppressing low signal intensity background voxels (black arrows) and exhibiting less scatter at intermediate signal intensities (gray arrows).

