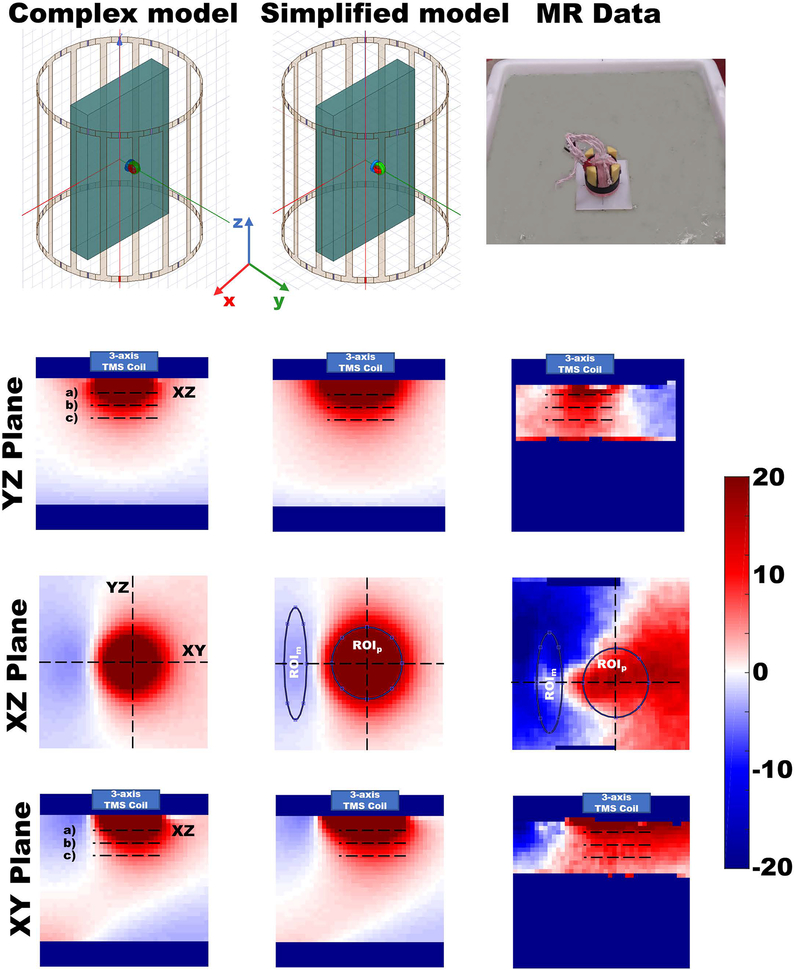
Figure 4.
Comparison of the relative field change patterns between the simulated data using either the complex or the simplified 3-axis TMS coil and the experimental data. Left column) Relative field change produced when placing the complex 3-axis TMS coil model on the ASTM block-phantom. Orientation of the axes corresponding to the YZ, XZ, and XY planes are shown in the top right panel. The positions of the YZ, XZ, and XY planes are indicated by the corresponding labels in the images. Red color is used to indicate field enhancement while blue shows field decrease. The blue box over the phantom shows the position and extent of the TMS coil model. Dashed lines marked with a), b), and c) denote the positions being used for evaluation of the field changes at 1.2 cm, 2.1 cm and 3 cm depths, respectively. The XZ plane depicted is at depth 1.2 cm. Center column) Relative field change produced when placing the simplified 3-axis TMS coil model on the ASTM block-phantom over the same slices as shown for the complex model. Right column) Relative field change pattern produced when placing the 3-axis TMS coil prototype on a physical gel phantom inside the MRI scanner. Slices depicted correspond to the ones shown for the complex and simplified model simulations. A picture of the experimental setup is shown on the top right part of the picture.

