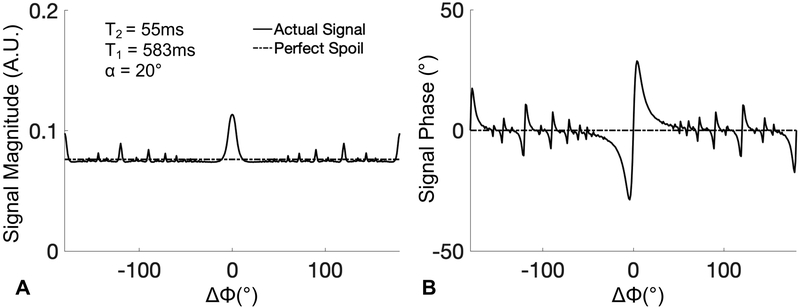
Figure 1.
GRE signal magnitude (A) and phase (B) over the full range of RF phase increments (ΔΦ), according to the method of Zur et al.22 By varying the RF phase increment, large variations in the magnitude and phase of the GRE signal are observed. Signal shown in this plot was generated using a Bloch equation simulation assuming T1=583ms and T2=55ms to simulate normal liver tissue21 at 1.5T, with TR=10ms and flip angle=20°.

