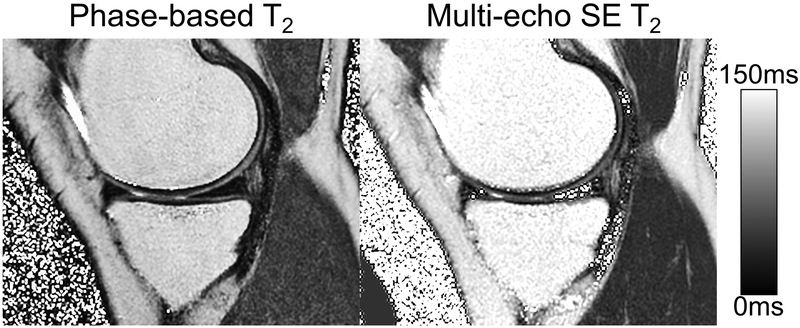
Figure 5.
T2 map generated with the phase-based T2 mapping showed excellent image quality in all six knees. Similar intensities can be observed in regions with dominant water signal such as cartilage and the muscle. An example of T2 maps generated using multi-echo SE MRI and the proposed method are shown.

