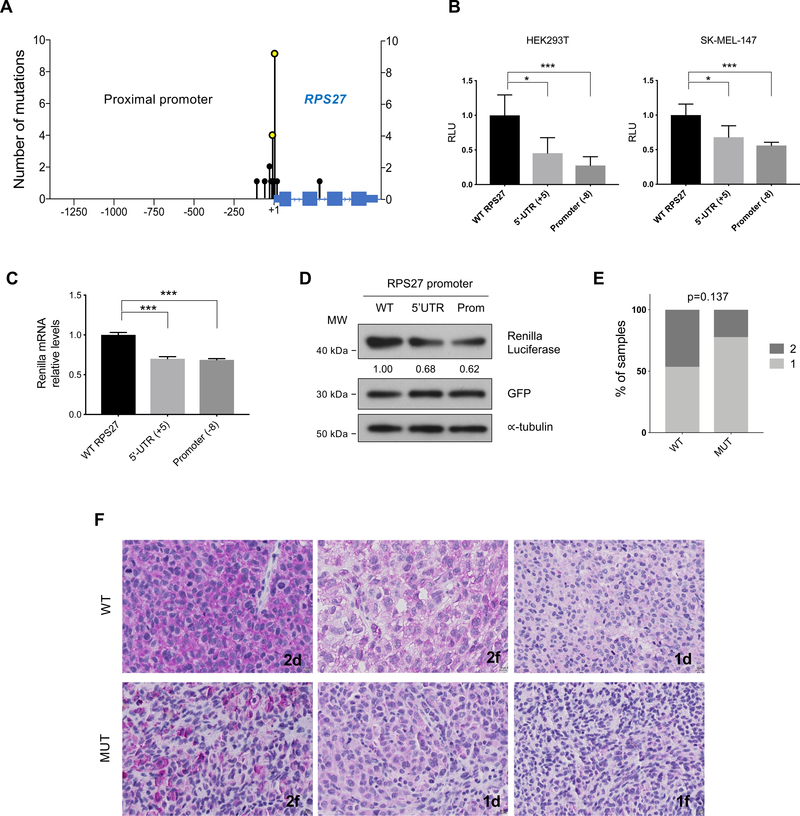
Figure 2.
Description of the mutations found in RPS27 and analysis of their effect on gene expression.
(A) Location (x-axis) and number of mutations (y-axis) detected in the RPS27 locus in the NYU TGS cohort. 1.3kb of the proximal promoter and the entire RPS27 gene are displayed. (B) Luciferase reporter assay of the RPS27 promoter (∼900 bp), using the WT and mutated constructs (at −8 and +5 bases from TSS). Error bars represent standard deviation of 5 independent experiments. (C) Quantitative PCR of Renilla luciferase mRNA expressed in HEK293T cells, using the same vectors as in (B). Renilla luciferase mRNA levels were relativized to GFP mRNA levels, control of transfection. Error bars represent SD. Data shows one of 3 independent experiments. (D) Renilla luciferase protein levels of HEK293T cells transfected with the reporter vectors (see B,C) analyzed by Western blot. For control of transfection, a vector expressing GFP was used. ∝-tubulin was used as loading control. Numbers represent the average quantification of Renilla luciferase from 3 independent experiments. (E) Percentage of WT (n=29) and MUT (n=9) melanoma samples from the TGS NYU cohort that present different levels of RPS27 protein expression, determined by IHC. Numbers 1 and 2 represent low and high RPS27 intensity, respectively. Fisher’s exact test was applied. (F) Representative 40x images of RPS27 IHC performed in metastatic melanoma patients from NYU TGS cohort. The percentage of positive cells is described by letters “d” (diffuse, >50%) and “f” (focal, <50%). ∗p < 0.05, ∗∗∗p < 0.001 by unpaired t-test.

