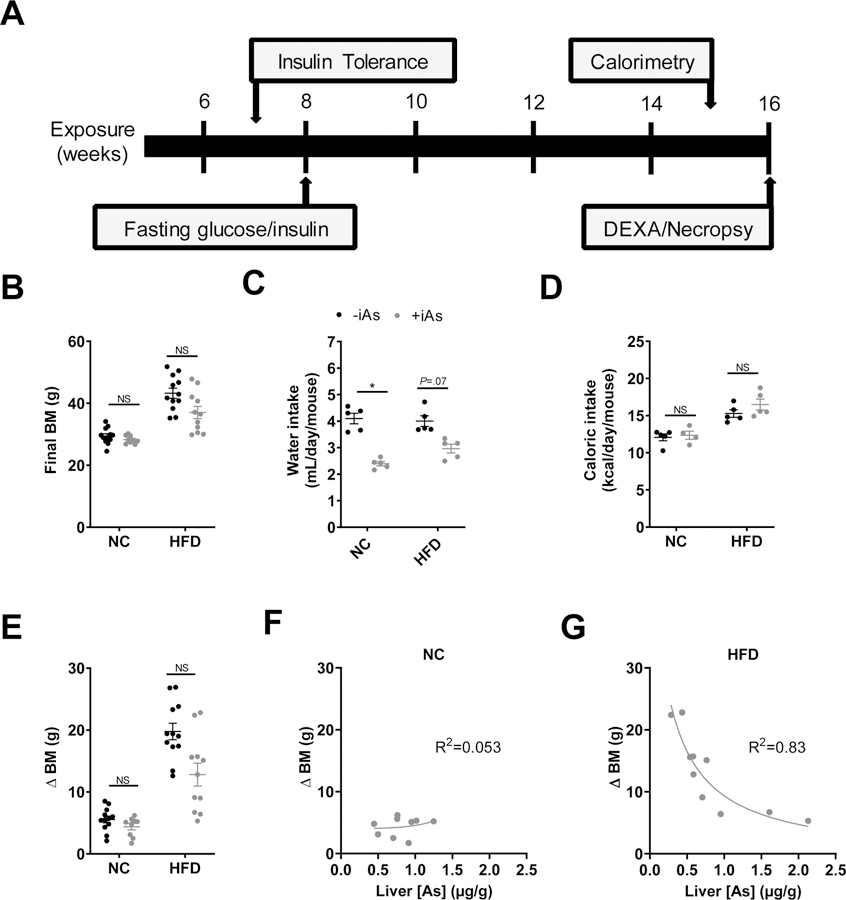
Figure 1. Arsenic reduces body mass following high fat feeding.
(A) Experimental timeline. (B) Final body mass, (C) daily water intake, and (D) caloric intake during 8 weeks of normal or high fat feeding +/− 50 mg/L arsenic exposure. (E) Total change in body mass of each mouse during the 8-week feeding protocol. Plot of the change in body mass versus liver arsenic concentration in arsenic-exposed mice with (F) normal diet or (G) high fat feeding. (F, G) Each plot was fitted with a 4-parameter logistic inhibitor dose-response curve using GraphPad Prism. Statistics: (B-E) Kruskal-Wallis test comparing groups within each dietary treatment, adjusted for multiple testing. *P<0.05 for the comparison indicated. Error bars are ±SEM.

