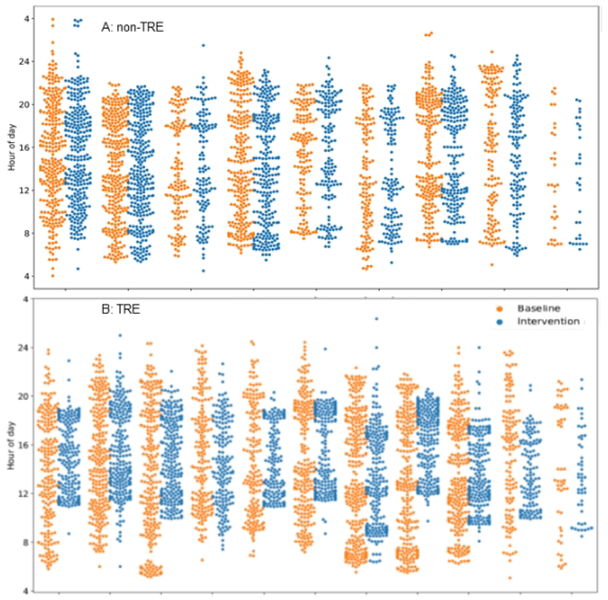
Figure 3:
Time of eating events in the non-TRE (A) and TRE group (B) Pre and End-Intervention. This figure depicts the clock hour for eating events at pre-intervention (orange; 2 weeks prior to randomization) and end-intervention (blue; 2 weeks prior to study conclusion) for each participant (Panel A: non-TRE, Panel B: TRE). Y axis: Clock hour for eating event (4=4AM, 24=midnight). X-axis: Each orange/blue combination represents an individual participant.

