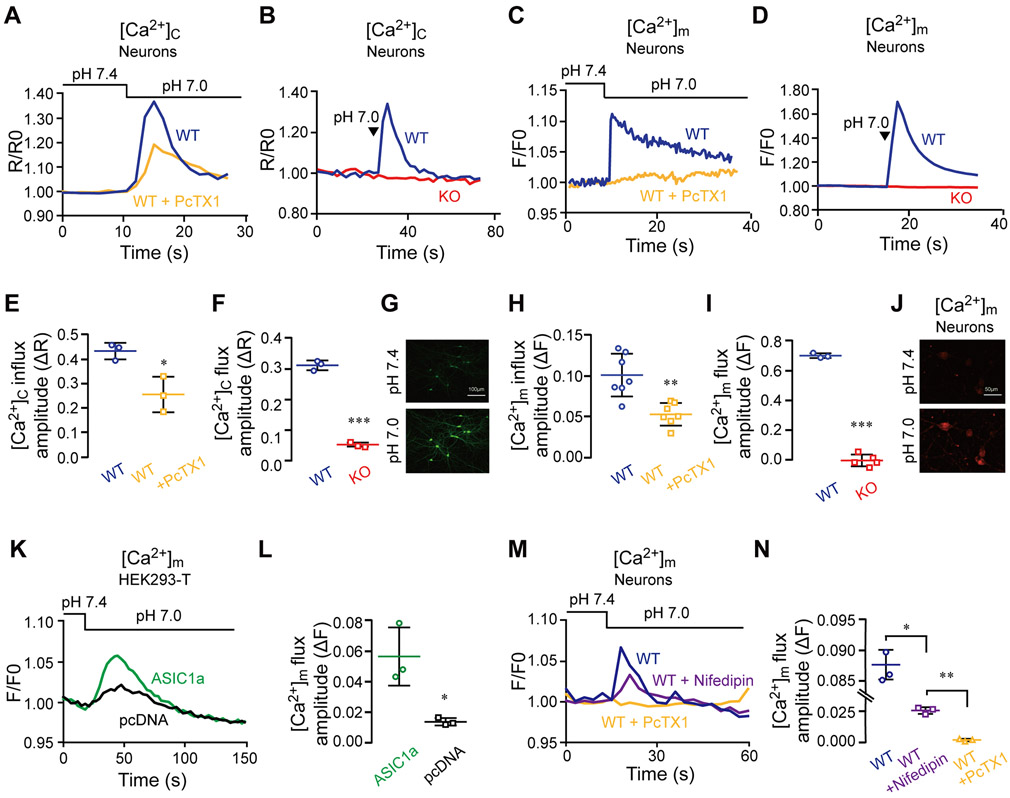
Figure 3. Physiological pH shift from 7.4 to 7.0 triggers a cytosolic Ca2+ response that is propagated to mitochondria.
A) Representative fluorescence ratio traces of pH-dependent cytosolic Ca2+ concentration ([Ca2+]c) changes monitored in untreated and PcTX1-pretreated WT neurons. Neurons were loaded with Fura-2-AM (1 μM) and pH change was carried out through superfusion.
(B) Quantification of [Ca2+]c increase as measured in (A) for untreated (n=3) and PcTX1-pretreated (n=3) neurons.
(C) Representative fluorescence ratio traces of [Ca2+]c changes induced by puffing with the pH 7.0 solution in WT and ASIC1a KO neurons loaded with Fura-2-AM.
(D) Quantification of [Ca2+]c increase as determined in (C) for WT (n=3) and ASIC1a KO (n=3) neurons.
(E) Reresentative images of neurons (x10) that were loaded with Fura-2-AM before and after pH shift in the presence of Ca2+. The scale bars represent 100 μm.
(F) Representative pH-dependent mitochondrial Ca2+ concentration ([Ca2+]m) changes induced by superfusion and monitored by fluorescence in Rhod-2 AM (1 μM) loaded WT neurons untreated and pretreated with PcTX1.
(G) Quantification of [Ca2+]m changes as measured in (E) for untreated (n=7) and PcTX1-pretreated (n=7) neurons.
(H) Representative fluorescence traces of [Ca2+]m changes induced by puffing the pH 7.0 solution in WT and ASIC1a KO neurons.
(I) Quantification of [Ca2+]m changes determined as in (G) for WT (n=3) and ASIC1a KO (n=4) neurons.
(J) Representative images of neurons (x20) that were loaded with Rhod-2 AM before and after pH shift in the presence of Ca2+. The scale bars represent 50 μm.
(K) Representative fluorescence traces of pH-dependent [Ca2+]m changes induced through superfusion in HEK293-T cells that overexpressed ASIC1a or were transfected with the empty vector (pcDNA).
(L) Quantification [Ca2+]m changes determined as in (I) for HEK293-T cells that overexpressed ASIC1a (n=3) and were transfected with pcDNA vector (n=3).
(M) Representative pH-dependent mitochondrial Ca2+ concentration ([Ca2+]m) changes induced by superfusion and monitored by fluorescence in Rhod-2AM (1 μM) loaded WT neurons pretreated with Nifedipin and PcTX1 separately.
(N) Quantification of [Ca2+]m changes as measured in (K) for untreated (n=3), Nifedipin (n=3) and PcTX1-pretreated (n=3) neurons
All bar graph data represent mean ± SEM, with n representing the number of independent cell cultures. *p < 0.05, **p < 0.01, ***p<0.001

