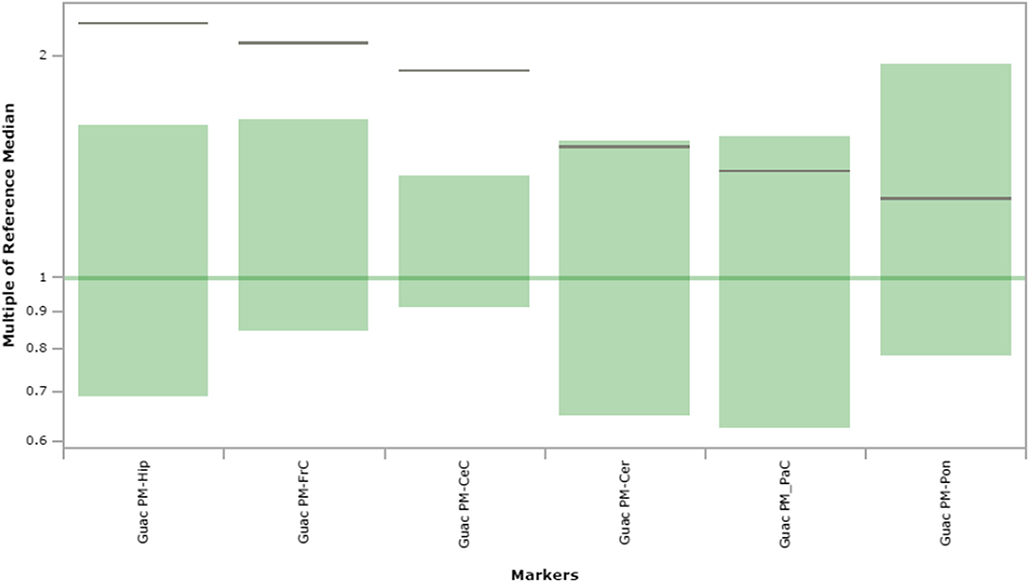
Fig. 11.
Guanidinoacetic acid content in extracts of brain regions spotted onto filter paper and quantified by tandem mass spectrometry. The figure depicts the range of control values (n = 4; green), with the control median set to 1.0 (dark green horizontal line). Patient values are depicted as a horizontal black line. The y-axis depicts “multiples of the reference (control) median”. Abbreviations: PM, post-mortem; FrC, frontal cortex; PaC, parietal cortex; Cer, cerebellum; Pon, pons; Hip, hippocampus; CeC, cerebral cortex; Guac, guanidinoacetic acid

