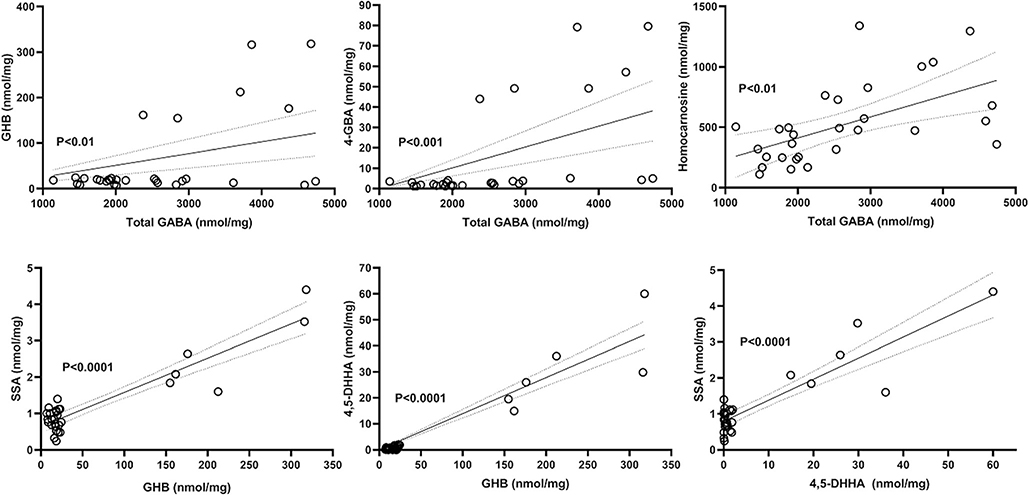
Fig. 13.
Correlations for GABA-related metabolites quantified by isotope dilution mass spectrometry. Data for both patient and controls is included. The top frame depicts the relationship of total GABAwith GHB, 4-GBA and homocarnosine, while the bottom frames the interrelationships of GHB, SSA and 4,5-DHHA. The values represent all analytical values across all brain regions for both n = 4 controls and the patient (regions: cerebellum, frontal and parietal cortices, pons, hippocampus, cerebral cortex, cerebellum). Abbreviations: total GABA (including both free and esterified GABA), γ-aminobutyric acid; GHB, γ-hydroxybutyric acid; 4,5-DHHA, 4,5-dihydroxyhexanoic acid; 4-GBA, 4-guanidinobutyric acid; SSA, succinic semialdehyde. Dashed lines indicate the 95% CI of the correlation analyses. Statistical analysis, Pearson correlation (P)

