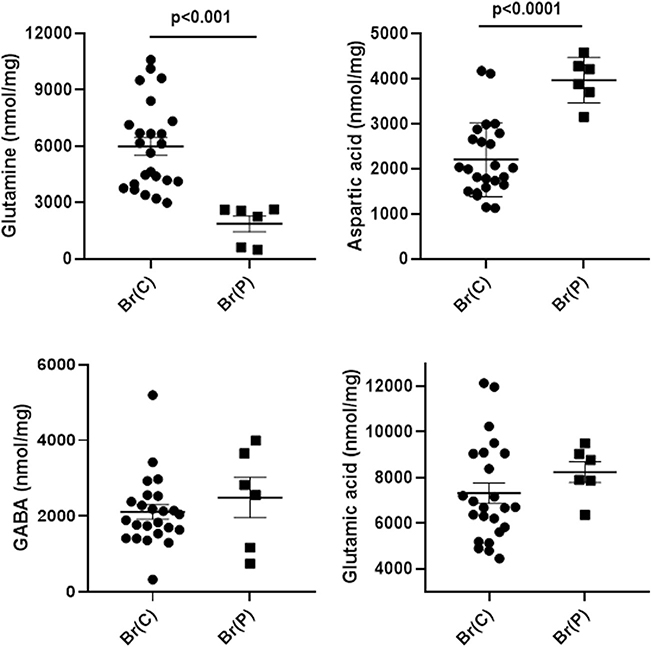
Fig. 3.
Neurotransmitter amino acids in brain extracts quantified by MassTrak analyses. X-axis abbreviations include pooled measures for control brain (Br(C)) and patient brain (Br(P)). The values represent the sum of all analyses across all brain regions for controls and the patient (regions: cerebellum, frontal and parietal cortices, pons, hippocampus, cerebral cortex, cerebellum; n = 24 for control, n = 6 for patient). Note that eight control autopsies (Table 1) were leveraged in order to obtain the total of n = 4 total control subjects comprising the six distinct brain regions corresponding to those of the patient. Statistical analyses, two-tailed t test. Data depicted as mean ± SEM. Glutamine serves primarily as a “shuttle” for both glutamic acid and GABA. In the absence of a hydrolysis step, GABA likely represents “free” GABA

