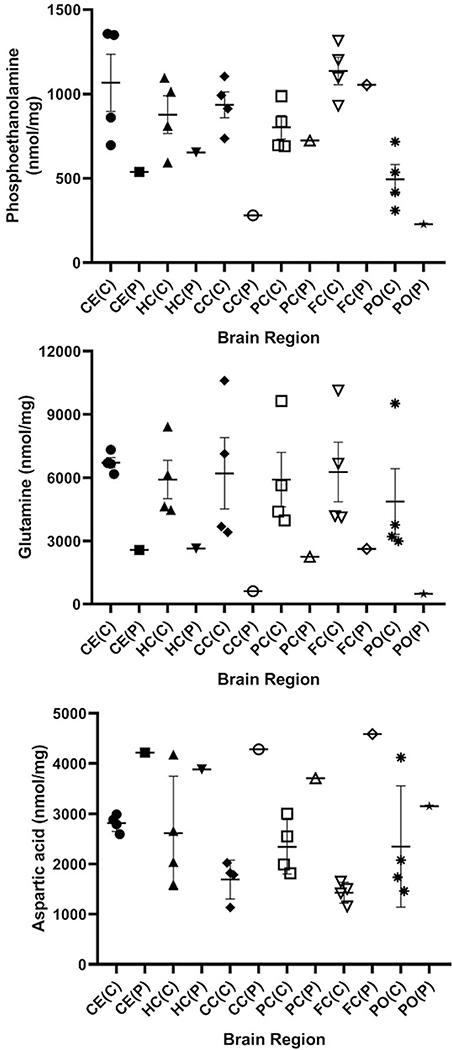
Fig. 5.
Amino acids derived from controls and patient stratified by brain region. The figure shows phosphoethanolamine, glutamine and aspartic acid, which were shown by pooled analyses (Figs. 2, 3) to be signifcantly different from control (two-tailed t test). Data for the control set (n = 4) is shown as mean +/− SEM. Abbreviations employed: CE, cerebellum; HC, hippocampus; CC, cerebral cortex; PC, parietal cortex; FC, frontal cortex; PO, pons; C, control; P, patient. Since only a single measure in each section was available from the patient, statistical analyses were not undertaken

