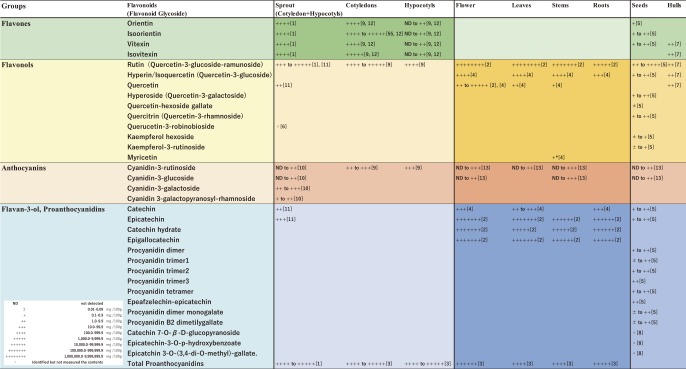
Fig. 1.
Distribution of flavonoids in buckwheat based on previous reports. This figure is based on Supplementary Figure S1 of Matsui et al. (2018a) with added information. References: [1] Matsui et al. (2008), [2] Li et al. (2010), [3] Matsui et al. (2016), [4] Kalinova and Vrchotova (2009), [5] Kiprovski et al. (2015), [6] Nam et al. (2015), [7] Watanabe et al. (1997), [8] Watanabe (1998), [9] Watanabe (2007), [10] Kim et al. (2007), [11] Park et al. (2017), [12] Nagatomo et al. (2014), [13] Kim et al. (2013). Plant materials, growing conditions, and methods of measurement were different in each paper.

