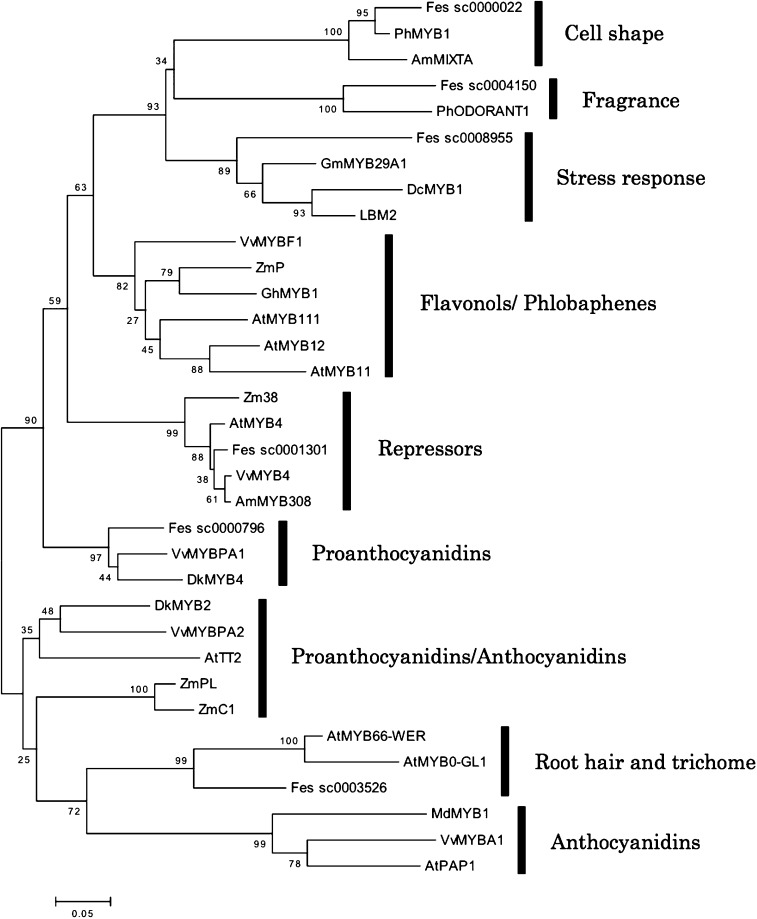
Fig. 4.
A phylogenetic tree for six putative R2R3 MYB transcription factors with representatives from other plants. Bootstrap values (500 replicates) are shown next to the branches. The scale bar corresponds to 0.05 substitutions per site. The root was assumed at the midpoint of the tree. This figure was derived from Supplementary Figure S2 of Yasui et al. (2016).

