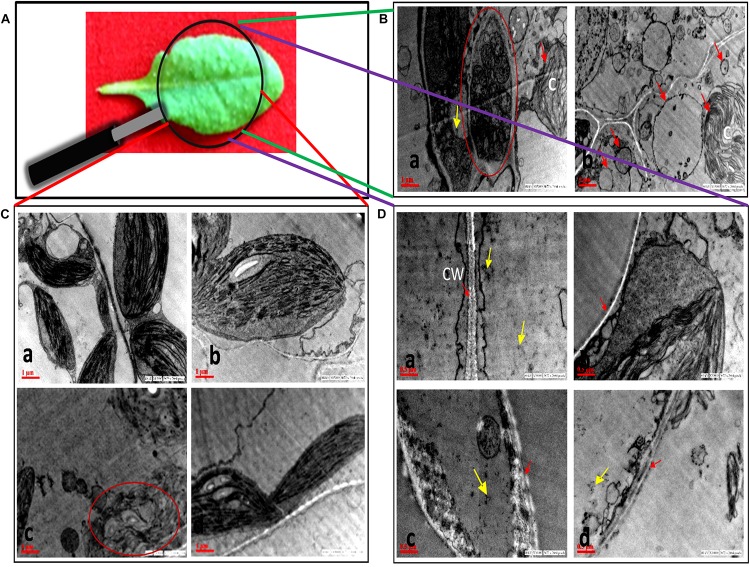
FIGURE 4.
Transmission electron micrographs of cell organelles of A. thaliana leaves across all treatments. (A) Sample image of A. thaliana leaf. (B) Autophagosomal structures in AB + SNP treatments. (a) Single membrane vesicles encapsulating several organelles (encircled with red) near chloroplast. (b) Membrane-bound autophagosomal structure near chloroplast. Arrow represents single-membrane autophagosomal structure, chloroplast is represented by (C). (C) Chloroplast of (a) control, (b) SNP, (c) AB alone, and (d) AB + SNP. Encircled image of AB represents damage in chloroplast. (D) Cell wall of (a) control, (b) SNP, (c) AB alone, and (d) AB + SNP. Arrow represents cell wall (CW). Cont, control; SNP, biogenic silver nanoparticles alone; AB, A. brassicicola-infected plants; AB + SNP, A. brassicicola-infected, treated with SNP. Yellow arrows represents SNPs.

