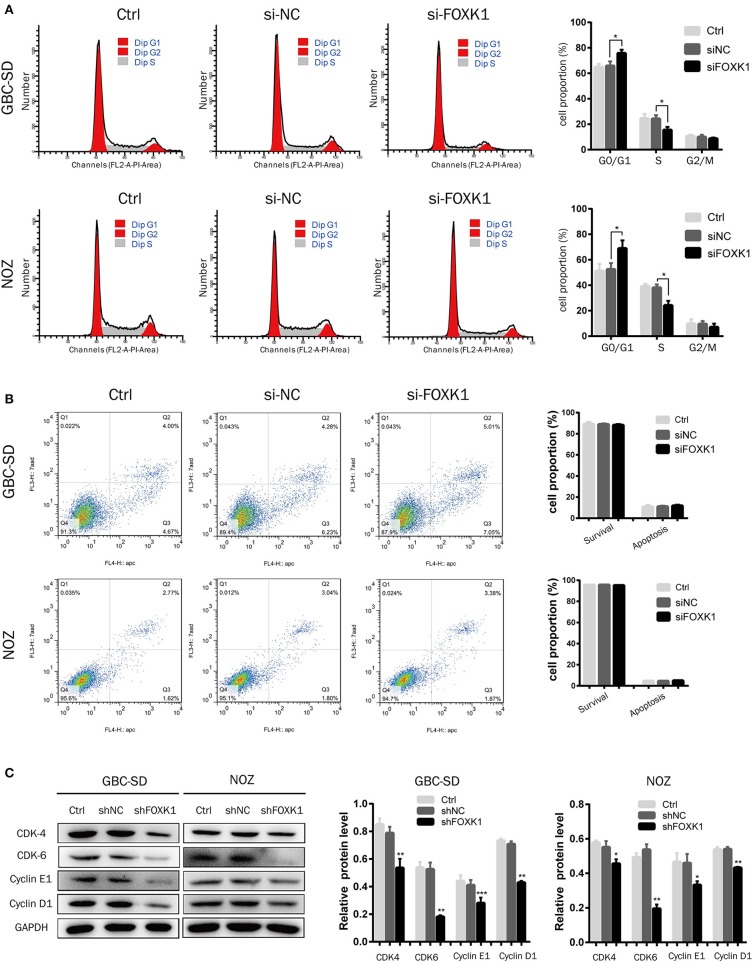
Figure 3.
Silencing of FOXK1 leads to G1-S cell cycle arrest. (A) The cell cycle distribution of treated cells was analyzed by flow cytometry after transfection of siRNA for 48 h. Percentage of cells of different phase were shown in the bar chart (*P < 0.05, **P < 0.01, and ***P < 0.001). (B) The cells were stained with Annexin-V/7-AAD after transfection of siRNA for 48 h. The Q4 quadrant (Annexin V-/7-AAD-), Q3 quadrant (Annexin V+/7-AAD-), and Q2 quadrant (Annexin V+/7-AAD+) indicated the percentages of normal cells, cells in early apoptosis, and cells in late apoptosis, respectively. Percentage of surviving cells and apoptotic cells were depicted in the bar chart (*P < 0.05, **P < 0.01, and ***P < 0.001). (C) The cell cycle regulator CDK-4, CDK-6, cyclin E1, and cyclin D1 were detected by Western blot analysis with indicated antibodies, GAPDH was used as loading control. (*P < 0.05, **P < 0.01, and ***P < 0.001).

