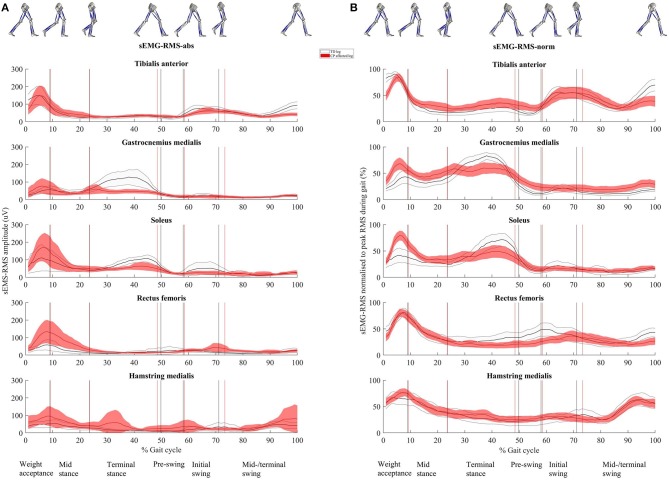
Figure 3.
(A) Root mean square (RMS) surface electromyographic (sEMG) amplitude (μV, sEMG-RMS-abs) and (B) RMS of sEMG normalized to peak RMS obtained during the gait cycle (%, sEMG-RMS-norm) for the five muscles. Time normalized to 0 to 100% of the gait cycle. Presented as mean (solid line) with 95% confidence interval (shaded area). The vertical lines represent the mean timing of the different events dividing the gait cycle into the six gait phases (named in the bottom line). Gray color is used for the healthy legs of typically developing children and red for the affected legs of children with CP. Illustrations of the right leg's events, separating the different phases, are seen at the top.

