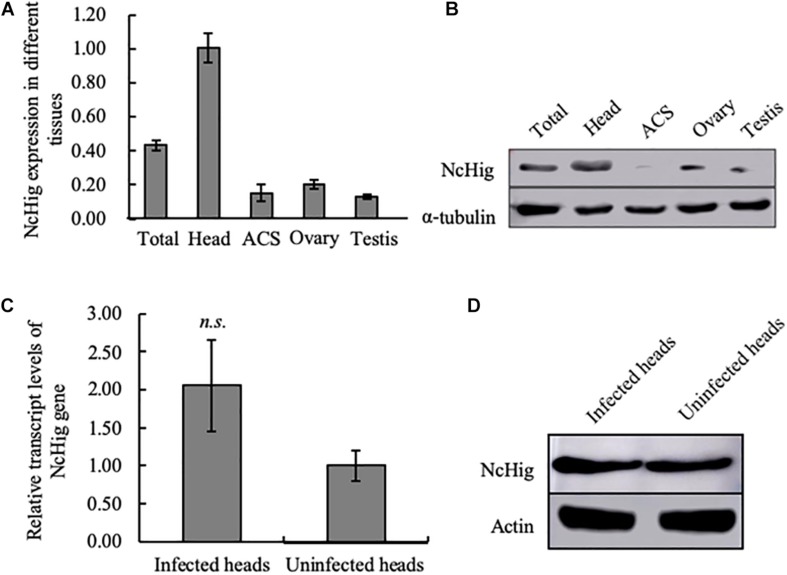
FIGURE 2.
The specific expression of NcHig in the CNS of N. cincticeps. (A) RT-qPCR assay of NcHig expression in total insect (total) and the indicated tissues of N. cincticeps. The detected transcript levels were normalized to the transcript levels of internal control actin gene and estimated using the 2–ΔΔCt (cycle threshold) method. ACS, alimentary canal. Values are the means (±SE) of three biological replicates. (B) Quantification of NcHig protein levels in the indicated tissues as determined by an immunoblot assay using NcHig-specific antibody. α-tubulin was used as the loading control. (C) Transcript levels of NcHig were normalized to the transcript levels of internal control actin gene in the virus-infected or uninfected heads of N. cincticeps, as detected by an RT-qPCR assay. Values are the means (±SE) of three biological replicates. (D) Accumulation of NcHig protein in the virus-infected or uninfected heads of N. cincticeps, as detected by an immunoblot assay. Insect β-actin was used as the internal control.

