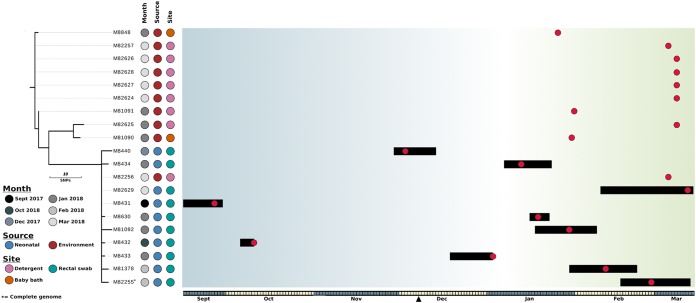
FIG 1.
Evolutionary relationship of K. michiganensis isolates. The maximum likelihood phylogenetic tree was built using 38 core genome SNPs, relative to K. michiganensis strain M82255, and was rooted using K. michiganensis strain CAV1374 (not shown). The month of isolation, source (neonatal or environmental), and specific site of isolation are indicated. Branches (black lines) represent the genetic distances between isolates in terms of SNPs. The scale is indicated. The outbreak timeline is presented adjacent to the tree. The timescale is represented at the bottom, with alternate months colored gray and yellow. The black triangle indicates the date on which the outbreak was declared and screening was switched from weekly to every 48 h. Each box in the timeline represents a period of 1 day, starting on 15 September 2017. Black bars represent the admission periods for colonized patients, and red dots represent dates on which samples were isolated (including environmental isolates). Blue shading represents periods in which there was no overlap in patient stays, and green shading represents periods in which multiple colonized patients were present in the SCN at the same time.

