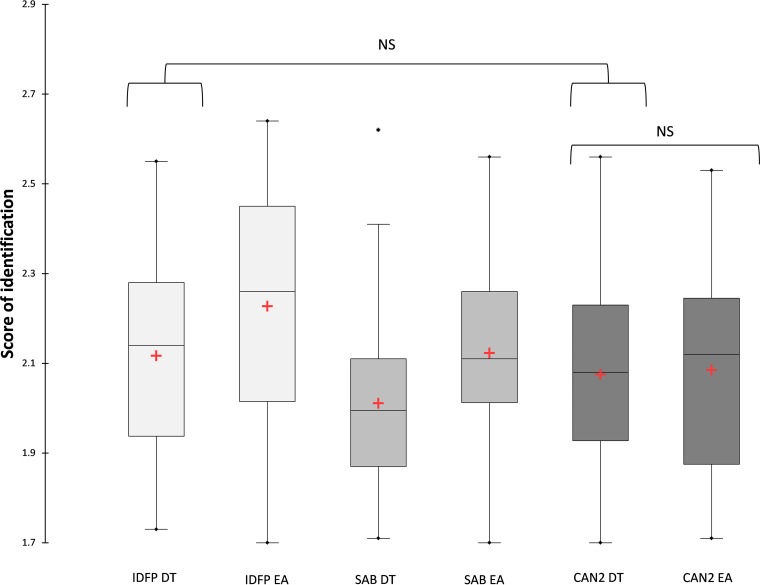
FIG 2.
Distribution of scores above 1.7 by culture plate and extraction protocol. Red plus signs correspond to means. Lines through boxes correspond to medians. Scores were significantly higher after EA than after DT on IDFP and SAB (P = 0.021 and 0.016, respectively). Scores after DT were significantly higher on IDFP than on SAB (P = 0.008). Scores after EA were significantly higher on IDFP than on SAB or CAN2 (P = 0.033 and 0.005, respectively). NS, nonsignificant differences.

