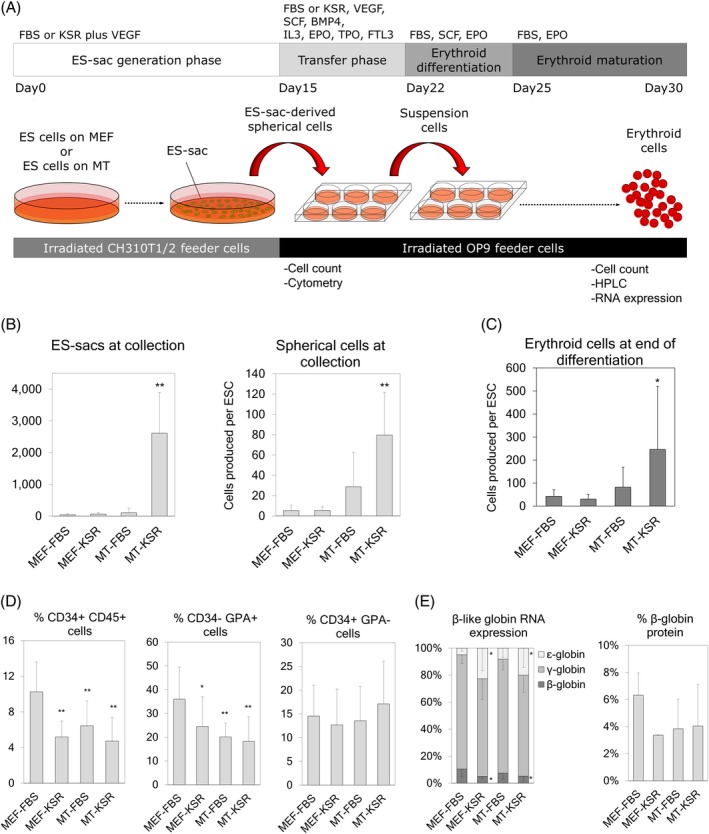
Figure 1.

A, ES‐sac generation from feeder cell‐on or feeder cell‐free human embryonic stem cells (hESCs). ES‐sacs were generated with serum‐containing or serum‐free media, and hematopoietic‐like spherical cells were differentiated into erythroid cells. B, Left panel: Yield of ES‐sacs generated per culture dish at day 15 using four different conditions (MEF‐FBS, MEF‐KSR, MT‐FBS, and MT‐KSR). Right panel: Yield of ES‐sac‐derived spherical cells per hESC at day of collection (day 15). C, Yield of erythroid cells produced per hESC during erythroid differentiation. D, Percentages of cell surface markers in ES‐sac‐derived spherical cells. E, β‐like globin production at the protein level in ES‐sac‐derived erythroid cells, analyzed by RP‐HPLC. Data reported as mean ± SD. Statistical analysis was performed by Dunnett's test, compared with the MEF‐FBS group (*P < .05 and **P < .01). MEF‐FBS, n = 3; MEF‐KSR, n = 3; MT‐FBS, n = 11; MT‐KSR, n = 15 for all analysis except for RNA expression (Figure 1E left: n = 2, n = 2, n = 5, and n = 7, respectively) and % β‐globin protein (Figure 1E right: n = 2, n = 2, n = 6, and n = 7, respectively). n indicates the number of experiments, performed in triplicates. HPLC analysis was performed in single runs. BMP4, bone morphogenetic protein 4; EPO, erythropoietin; FBS, fetal bovine serum; FL, fms‐like tyrosine kinase 3 ligand; GPA, glycophorin A; IL3, interleukin‐3; KSR, knockout serum replacement; MEF, mouse embryonic fibroblasts; MT, Matrigel; qPCR, quantitative polymerase chain reaction; RP‐HPLC, reverse phase high pressure liquid chromatography; SCF, stem cell factor; TPO, thrombopoietin; VEGF, vascular endothelial growth factor
