
Figure 4.
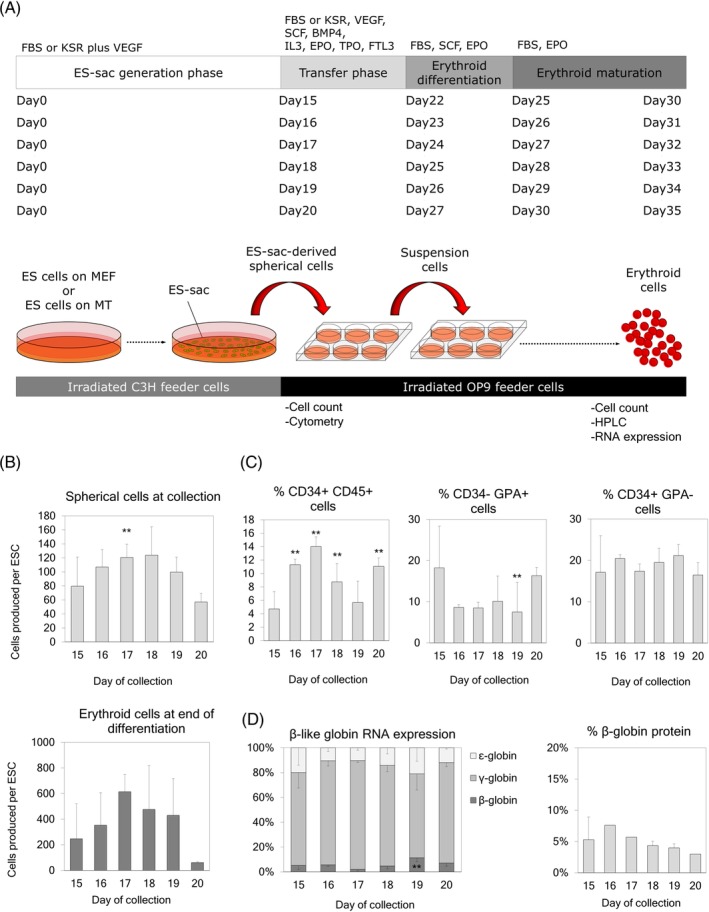
A, Timeline for extension of ES‐sac generation culture (15, 16, 17, 18, 19, and 20 days). B, Upper panel: Yield of ES‐sac‐derived spherical cells per hESC for various durations of ES‐sac generation. Lower panel: Yield of erythroid cells produced per hESC from spherical cells from different collection times. C, Percentages of cell surface markers in ES‐sac‐derived spherical cells after various durations of ES‐sac generation. D, Left panel: β‐like globin gene RNA expression after erythroid differentiation. Right panel: β‐globin production at the protein level, analyzed by RP‐HPLC. Data reported as mean ± SD. Statistical analysis was performed by Dunnett's test, compared with the 15‐day collection group (**P < .01). Day 15, n = 15; Day 16, n = 1; Day 17, n = 1; Day 18, n = 3; Day 19, n = 5; Day 20, n = 1 for all the analysis except for RNA analysis (Figure 4D left: n = 7, n = 1, n = 1, n = 3, n = 2, and n = 1, respectively) and β‐globin protein analysis (Figure 4D right: n = 7, n = 1, n = 1, n = 3, n = 2, and n = 1, respectively). n indicates the number of experiments, performed in triplicates. HPLC analyses were performed in single runs. hESC, human embryonic stem cell; RP‐HPLC, reverse phase high pressure liquid chromatography