
Figure 7.
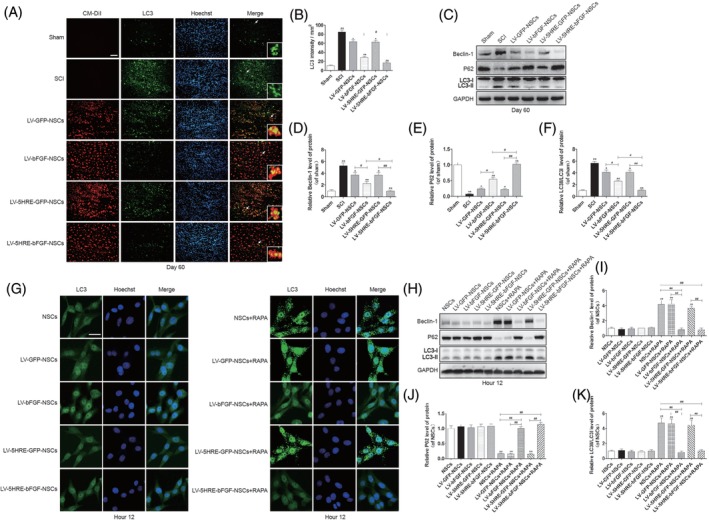
Hypoxia regulated LV‐5HRE‐bFGF‐NSCs reduce autophagy. A, The representative images of LC3 immunostaining in the longitudinal spinal cord section from an animal in sham group, SCI group, LV‐GFP‐NSCs group, LV‐bFGF‐NSCs group, LV‐5HRE‐GFP‐NSCs group, and LV‐5HRE‐bFGF‐NSCs group, illustrating lesion morphology and transplant at 60 days after SCI. Transplanted NSCs express red fluorescent signals (CM‐DiI). Green fluorescence represents LC3. The nuclear is labeled by Hoechst (blue). Scale bar = 200 μm. B, Quantification of LC3 staining intensity per unit area. C, The protein expressions of Beclin‐1, P62 and LC3 in sham group, SCI group, GFP‐NSCs group, LV‐bFGF‐NSCs group, 5HRE‐GFP‐NSCs group, and LV‐5HRE‐bFGF‐NSCs group in 60 days. GAPDH was used as the loading control and for band density normalization. D‐F, The optical density analysis of Beclin‐1, P62, and LC3 protein. * represents P < .05 and ** represents P < .01 vs the SCI group, # represents P < .05 and ## represents P < .01, data are the mean values ± SEM, n = 3. G, Rapamycin treatment of NSCs under normal or hypoxia (pO2 < 1%) condition for 12 hours, the immunofluorescence staining results of LC3 in vitro. Green fluorescence represents LC3. The nuclear is labeled by Hoechst (blue). Scale bar = 20 μm. H, The protein expressions of Beclin‐1, P62, and LC3 were analyzed by Western blotting in 12 hours after rapamycin treatment. GAPDH was used as the loading control and for band density normalization. I‐K, The optical density analysis of Beclin‐1, P62, and LC3 protein. ** represents P < .01 vs the NSCs group, LV‐GFP‐NSCs group, and LV‐5HRE‐GFP‐NSCs group, ## represents P < .01, data are the mean values ± SEM, all experiments were repeated three times. 5HRE, five hypoxia‐responsive elements; bFGF, basic fibroblast growth factor; NSC, neural stem cell; SCI, spinal cord injury