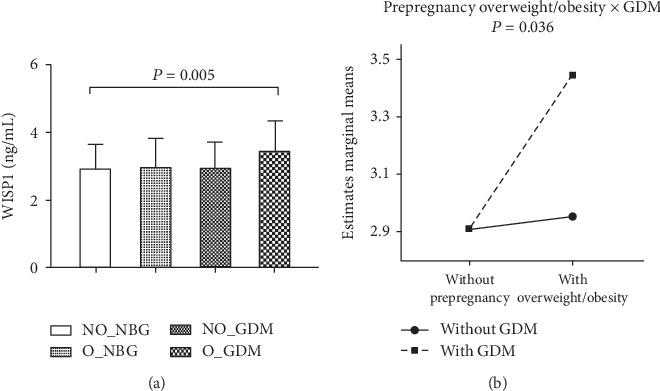
Figure 1.

Comparison of circulatory abundance of WISP1 among the four groups. (a) Bar graphs represent plasma WISP1 concentration, and (b) line graphs represent the directions of interaction effect of obesity and GDM on WISP1 in pregnant women categorized into four groups, including (1) nonoverweight or obesity subjects with normal blood glucose (NO_NBG; n = 196), (2) overweight or obesity subjects with normal blood glucose (O_NBG; n = 56), (3) nonoverweight or obesity subjects with gestational diabetes mellitus (NO_GDM; n = 33), and (4) overweight or obesity subjects with gestational diabetes mellitus (O_GDM; n = 28).
