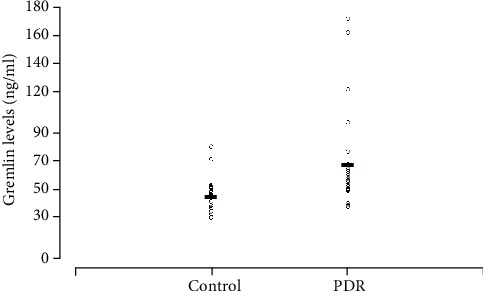
Figure 2.

Scatter plot showed the levels of gremlin in the vitreous from the eyes with proliferative diabetic retinopathy (PDR, n = 26) and idiopathic epiretinal membrane (control samples, n = 22). Open circles represent the vitreous levels of gremlin. The horizontal lines indicate the mean concentration of gremlin in each group.
