Figure 3.

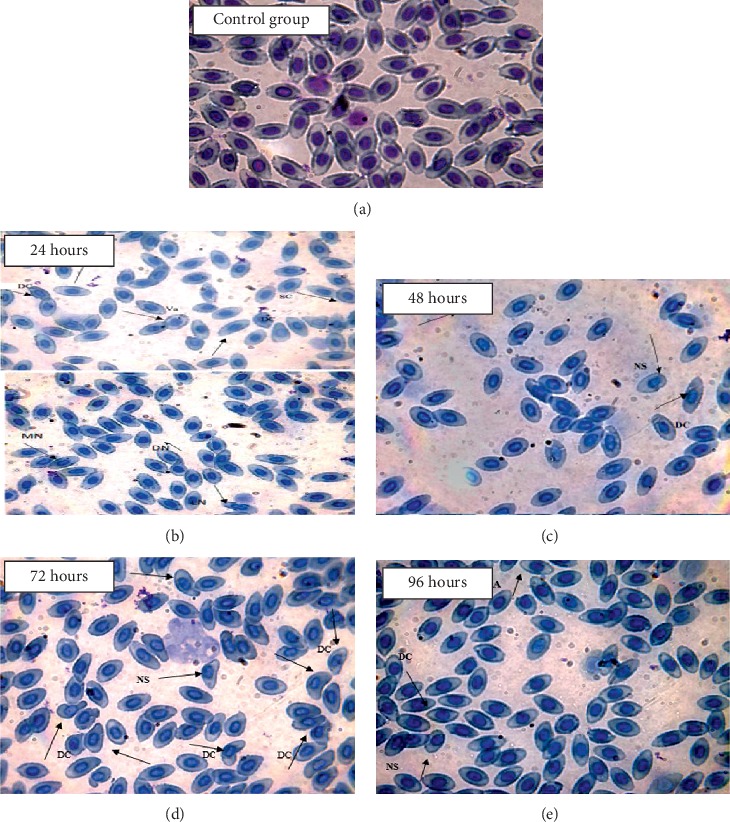
(100x) Showing RBC nucleus and cell abnormalities in comparison with the control group against the treatment LC15 of chromium: (a) control group; (b) 24 hours; (c) 48 hours; (d) 72 hours; (e) 96 hours.

(100x) Showing RBC nucleus and cell abnormalities in comparison with the control group against the treatment LC15 of chromium: (a) control group; (b) 24 hours; (c) 48 hours; (d) 72 hours; (e) 96 hours.