Table 4.
Structures and mechanism of cell death induced by vanadium compounds (EMT: the epithelial–mesenchymal transition).
| Structure | Mechanism | References |
|---|---|---|
|
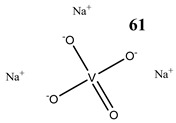
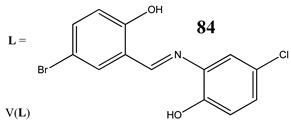
Oral squamous cell carcinoma Cal27 Induction of apoptosis: poly(ADPribose)polymerase cleavage Cytotoxicity (72 h): IC50 25 μM |
[88] |
|
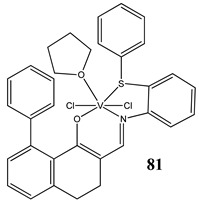
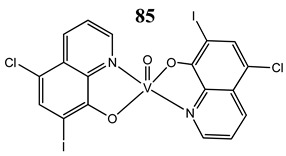
Gastric cancer cells MGC-803 Induction of apoptosis (upregulation of Bax, PARP and caspase-3/9, downregulation of Bcl-2) Prevention from the colony formation, migration and EMT process Cytotoxicity (72 h): IC50 2.69 μM |
[89] |
|
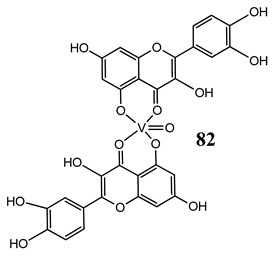
Breast cancer cells MCF-7 Increase in the expression of p53 Decrease in the expression of Akt, mTOR and VEGF Induction of apoptosis (activation of 3 and 9 caspase, DNA fragmentation) In vivo study (Balb/c mice) Increase in apoptotic index Upregulation of Bcl-2 and downregulation of Bax and p53 |
[90] |
|
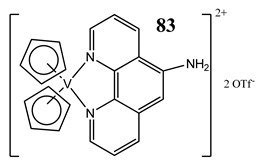
T-leukemic cells (p53 wild-type MOLT-4 and p53-deficient Jurkat) Induction of apoptosis (activation of the caspases 9-intrinsic pathway and 8-extrinsic pathway) Increase in the expression of the tumor-suppressor protein p53 and its form phosphorylated at the serine 15 Cytotoxicity: 24 h: MOLT-4 IC50 3.1 ± 0.4 μM Jurkat IC50 2.9 ± 0.2 μM 48 h: MOLT-4 IC50 2.1 ± 0.2 μM Jurkat IC50 2.8 ± 0.3 μM 72 h: MOLT-4 IC50 2.3 ± 0.2 μM Jurkat IC50 1.7 ± 0.1 ± μM |
[91] |
|
Liver cancer cells HepG2 Induction of apoptosis (using the p53/p21 pathway-dependent way) Decrease in the expression of caspase-8 and Bid |
[92] |
|
Osteosarcoma cells MG-63 Determination of the relative abundance of 224 proteins Increase in the expression of caspase 3, caspase 6, caspase 7, caspase 10, caspase 11, Bcl-x, DAPK Decrease in the expression of PKB/Akt, DIABLO |
[93] |
|
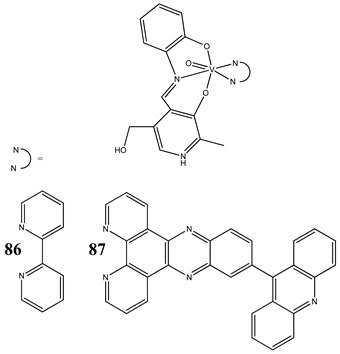
Cervical cancer cells HeLa Breast cancer cells MCF-7 Induction of apoptosis Specific localization to endoplasmic reticulum (ER) Cytotoxicity (48 h): cervical cancer cells HeLa (86: IC50 44.1 ± 1.8 µM in visible light IC50 59.3 ± 1.7 µM in the dark) (87: IC50 0.24 ± 0.02 µM in visible light IC50 > 40 µM in the dark) breast cancer cells MCF-7 (86: IC50 53.3 ± 1.9 µM in visible light IC50 72.5 ± 2.1 µM in the dark) (87: IC50 0.53 ± 0.03 µM in visible light IC50 > 40 µM in the dark) |
[94] |
|
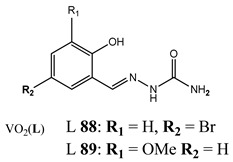
Colon cancer cells HT-29 Induction of necroptosis |
[100] |
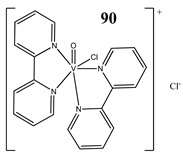
|
Breast cancer cells MDA-MB-231 G2/M cell cycle arrest Induction of autophagy Induction of apoptosis Increase in the expression of Notch 1 |
[101] |
|
91 MSAGM:VO MSAGM = Galactomannan from Schizolobium amazonicum |
Liver cancer cells HepG2 Induction of apoptosis under normoxic conditions (lost under hypoxic conditions) The expressions of anti-apoptotic Mcl-1 and Bcl-XL increased in hypoxia, whereas the expression of pro-apoptotic Bax decreased Induction of autophagy (elimination of the anti-cancer activity with activation of autophagy under conditions of hypoxia) |
[102] |
Bold and Underline: makes Table more readable.
