
Figure 6.
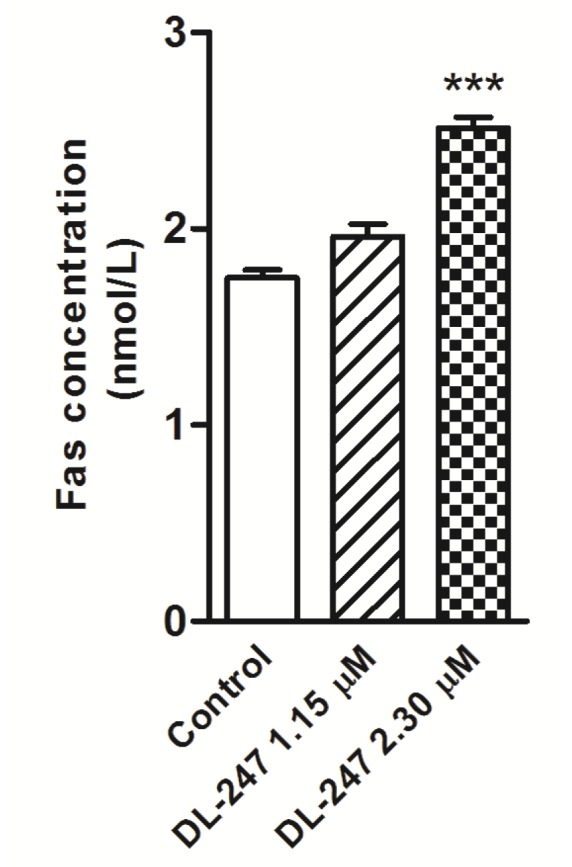
Changes in Fas concentration in HL-60 cells treated with DL-247 for 24 h analyzed by Human Fas ELISA kit. Data are presented as mean ± SEM of three independent experiments. Statistical significance was assessed using one-way ANOVA and a post-hoc multiple comparison Student–Newman–Keuls test. *** p < 0.001 vs. control.