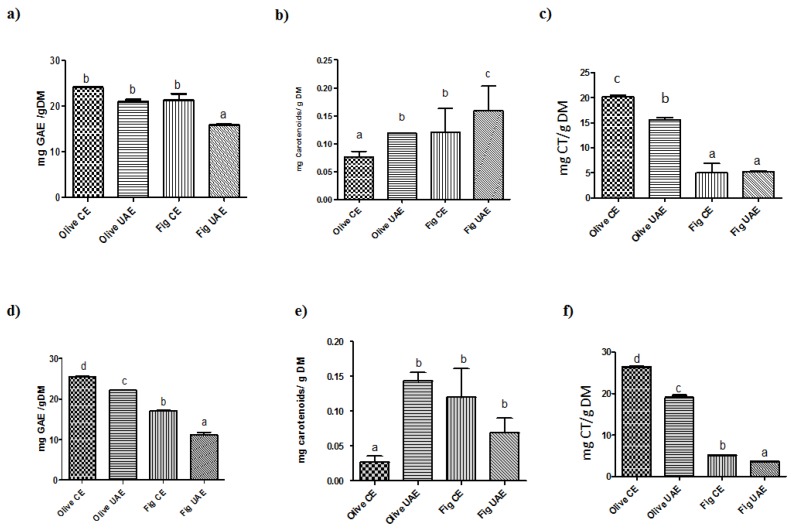
Figure 2.
Content of total phenolics, flavonoids and carotenoids in fig and olive leaves extracts after conventional (CE) or ultrasound-assisted (UAE) extraction using either aqueous (a–c) or hydroethanolic (d–f) solvents. Total phenolic content (mg gallic acid equivalents (GAE)/g dry matter (DM)) (a,d), total flavonoid content (mg catechin (CT)/g DM) (b,e) and the carotenoids content (mg carotenoids/g DM sample) (c,f). Bars represent mean and standard error. Different letters comparing treatments represent statistically different mean values (p < 0.05).

