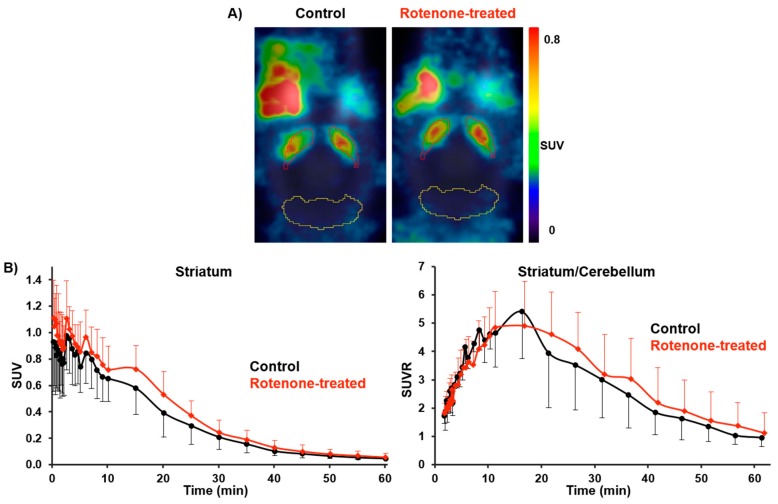
Figure 6.
(A) Representative horizontal PET images of [18F]FESCH uptake (average 2–61 min) in the brain of control and rotenone-treated C57BL/6JRj mice (red = striatum; yellow = cerebellum). (B) Averaged TACs of [18F]FESCH for control (n = 5) and rotenone-treated mice (n = 7) with SUVs for striatum and SUVRs for striatum over cerebellum.

