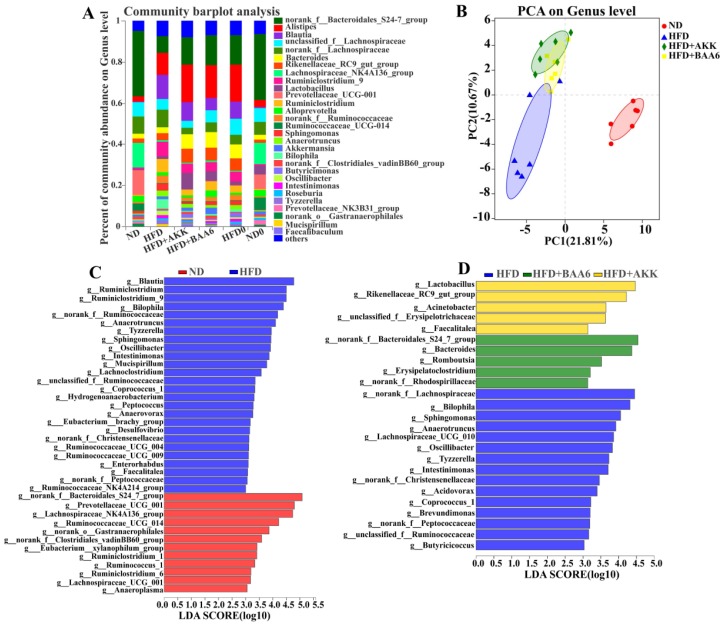
Figure 3.
Effects of BAA6 or AKK on gut microbiota in HFD-fed mice. (A) Relative abundance of the gut microbial community at the genus level. (B) Principal component analysis (PCA) score plots at the genus level. (C) Histogram of the linear discriminant analysis (LDA) scores between the ND and HFD groups, and (D) histogram of LDA scores among the HFD, HFD + AKK, and HFD + BAA6 groups. The differences with an LDA score greater than three are considered significant. n = 6 mice/group. HFD0, fed high-fat diet for nine weeks; ND0, fed normal diet for nine weeks.

