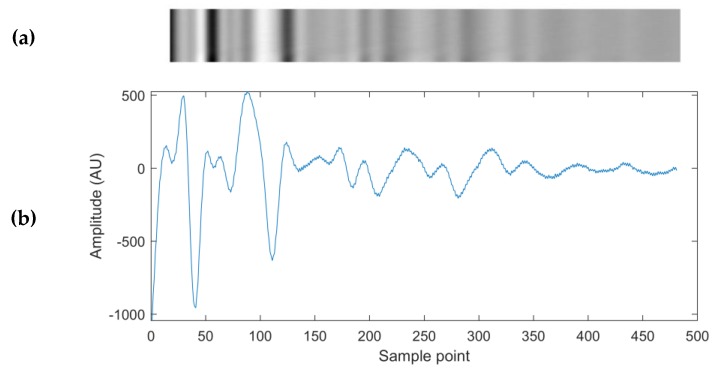
Figure 3.
(a) A grey-scale representation of the input matrix to the time domain input Convolutional Neural Networks (CNNs), constructed of 25 ultrasound waveforms similar to the waveform depicted below it in Figure 3b. The bright pixels correspond to the maximum amplitude values of the 25 waveforms, and the dark pixels correspond to the minimum amplitude values. (b) An example of an ultrasonic waveform used in each row of the time domain input matrix.

