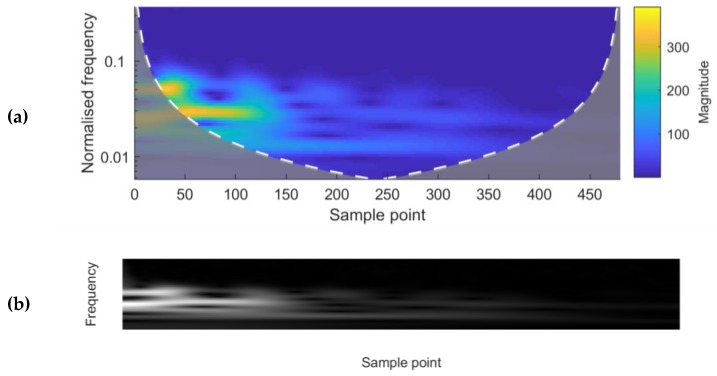
Figure 4.
(a) A frequency-time domain magnitude scalogram after the Continuous Wavelet Transform (CWT) of a single waveform. The sample points correspond to the sample points of the original waveform. (b) A grey-scale image representation of the matrix used as an input to the CNN. It contains the absolute values after the CWT of the same waveform as used for Figure 4a. The bright pixels correspond to the maximum frequency amplitudes, and the dark pixels to the minimum.

