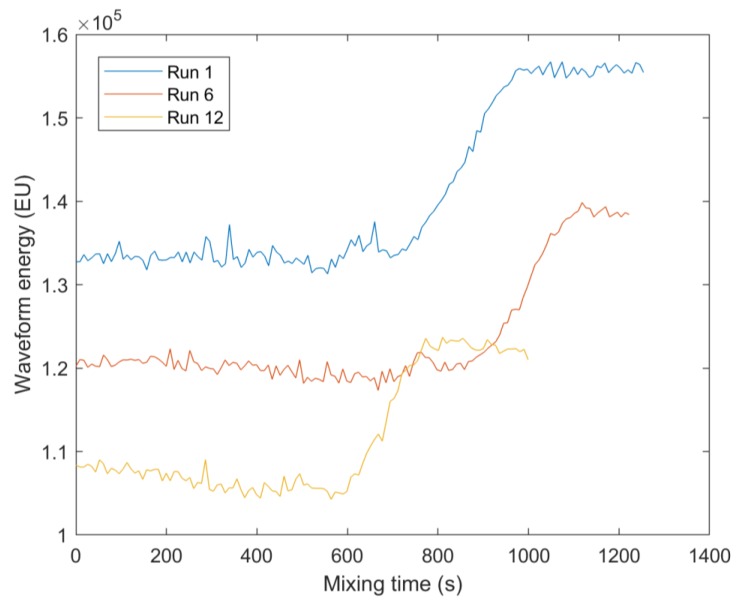
Figure 6.
Waveform energy profiles for Run 1 (20 mL honey, 200 rpm impeller speed, 19.4 °C average temperature), Run 6 (30 mL honey, 200 rpm impeller speed, 20.1 °C average temperature), and Run 12 (30 mL honey, 250 rpm impeller speed, 20.7 °C average temperature). Only three runs are presented to aid visibility of the parameter profiles. This figure displays the variation in waveform energy levels in the data, highlighting the need of Machine Learning (ML) methods to monitor the mixing process.

