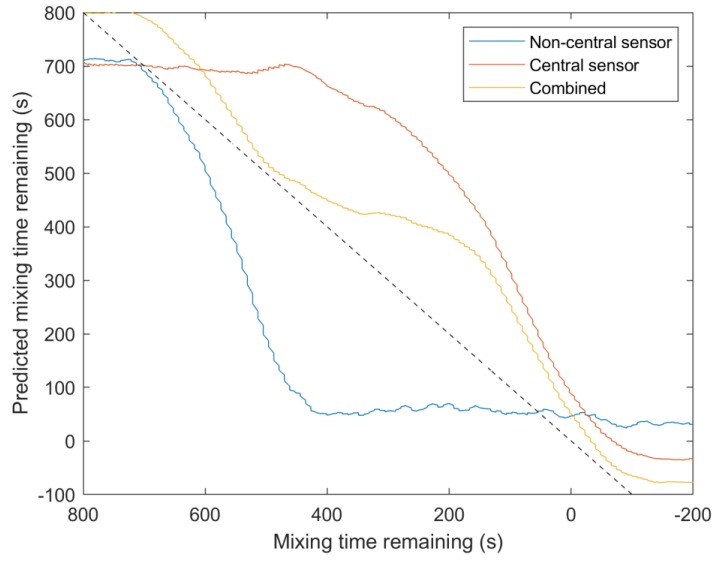
Figure 8.
A comparison between regression predictions during honey-water blending for the central sensor, non-central sensor, and combining the outputs from both sensors. A time domain input CNN was used as the learning algorithm. R2 values: 0.825 non-central sensor, 0.936 central sensor, and 0.975 multisensor data fusion.

