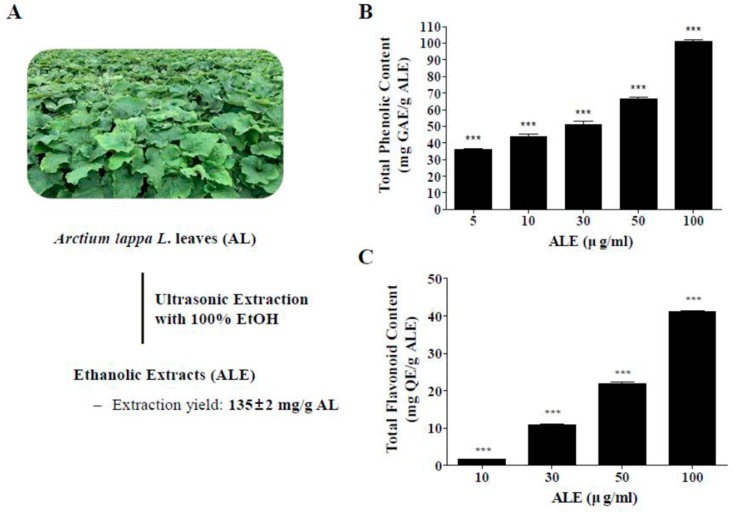
Figure 1.
Extraction of AL and total polyphenol contents in extract of AL leaves (ALE). (A) Ethanolic extracts and extraction yield of ALE. (B) TPCs in ALE in a dose range from 5 to 100 μg/mL. (C) TFCs in ALE in a dose range from 10 to 100 μg/mL. The values represent the mean ± SD (n ≥ 3). ***p < 0.001 vs blank group, one-way ANOVA with Tukey’s post hoc test. TPC, total phenolic content; TFC, total flavonoid content; GAE, gallic acid equivalent; QE, quercetin.

