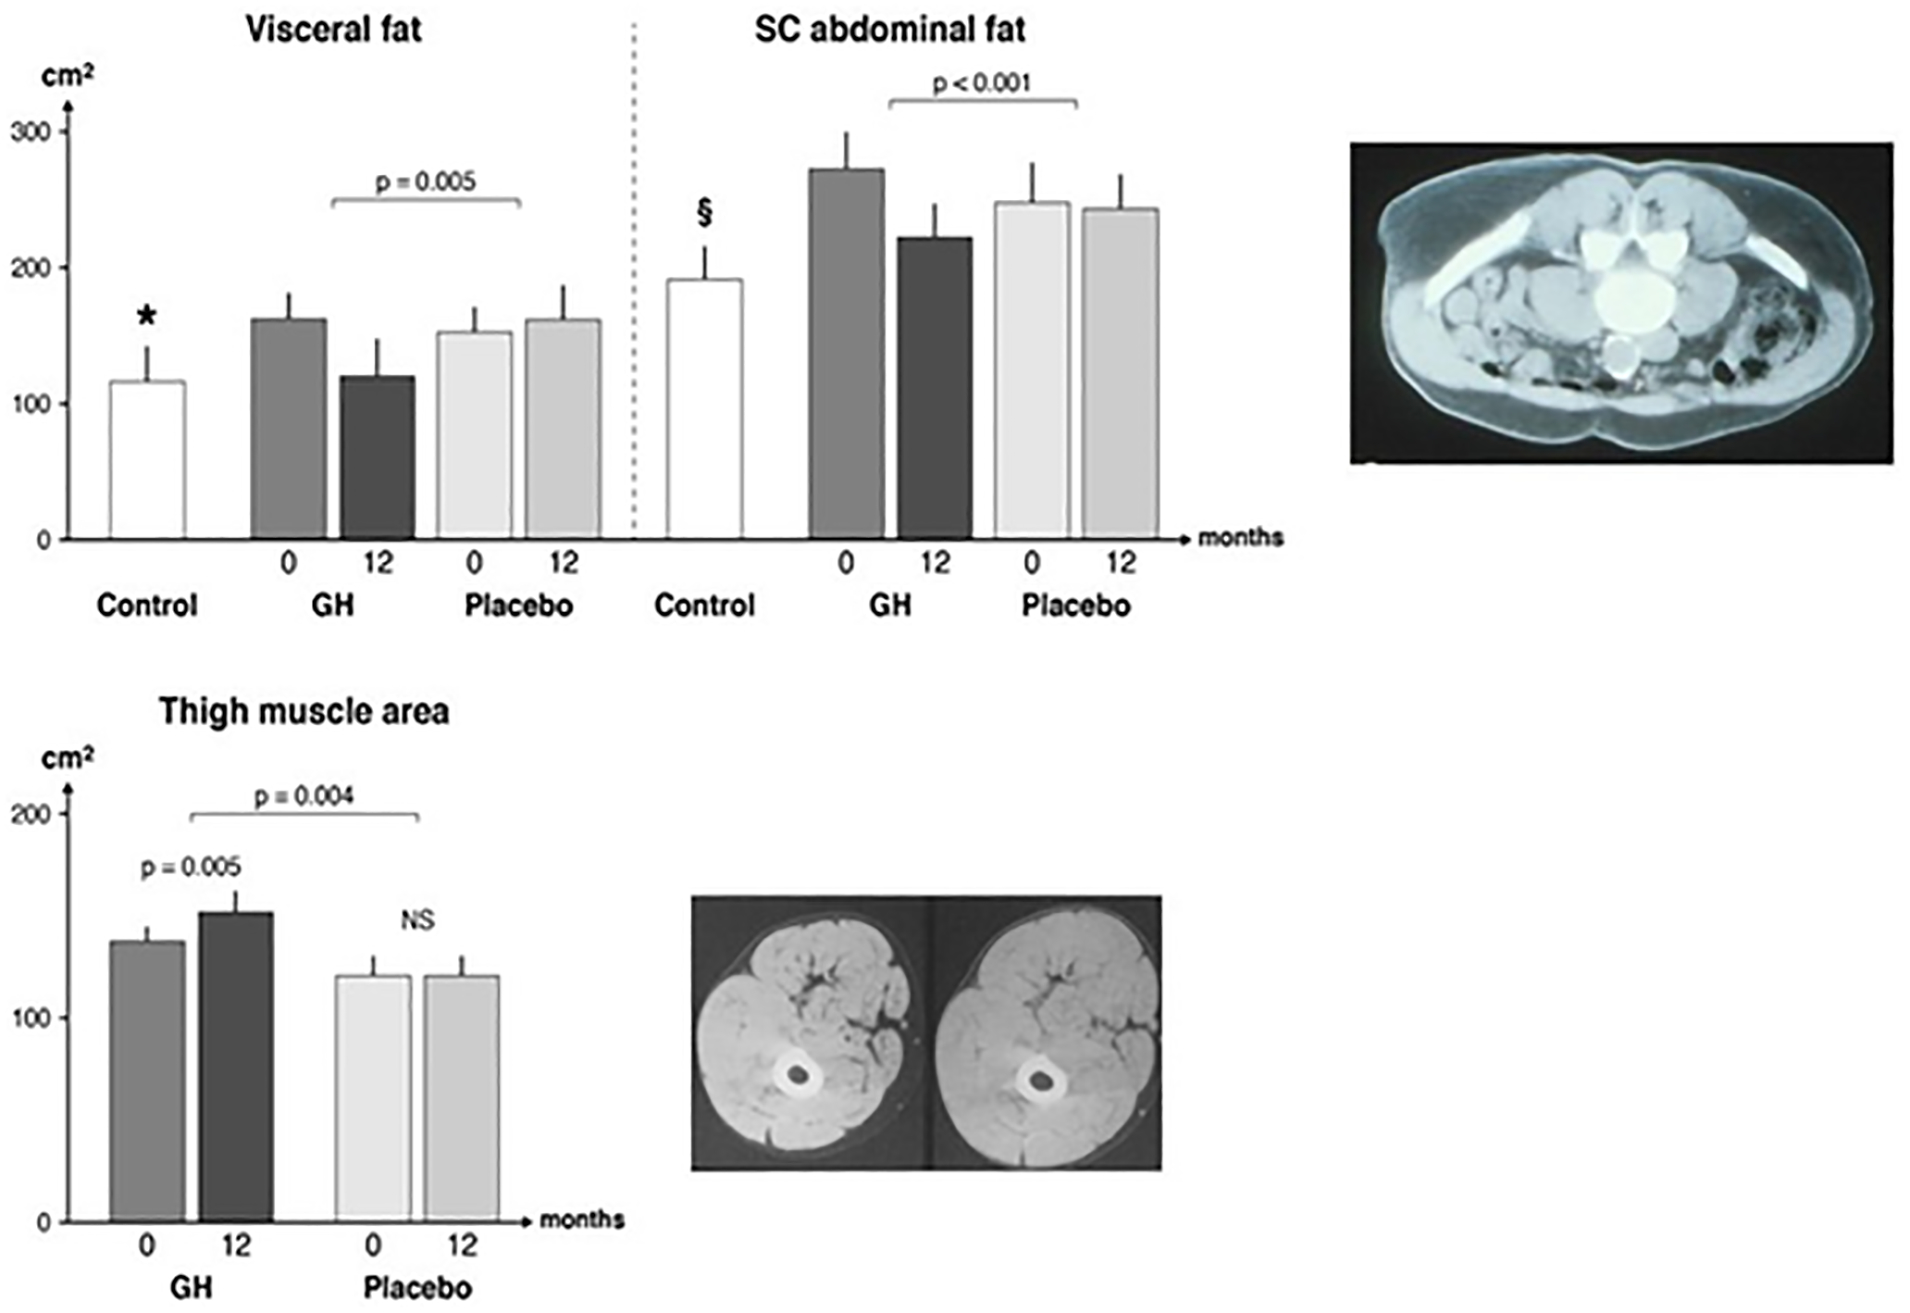
Figure 2: Body composition assessed by CT in adults with GH-deficiency.

Patients with GH-deficiency participated in a double-blind parallel study receiving either GH or placebo. The patients were studied at baseline (0) and after 12 months treatment (12). The results were compared with a reference population (n = 29) matched for age and sex (control). The P values denote a comparison of changes between the GH and placebo groups, respectively. Visceral fat lower in the reference group as compared to all patients at baseline, as shown by * (P = 0.02). Subcutaneous fat was lower in the reference group as compared to all patients a baseline, as shown by § (P = 0.03). The data were originally presented in42. The CT images are representative scans from the mid-umbilical region before (upper) and after (lower) GH treatment (upper panel). This scan derives from a separate trial125 and is reproduced with the permission from the principal investigator. The lower panel includes a representative CT scan from the first study42 before (right) and after (left) GH treatment. Upper CT image panel reproduced with permission125. Lower CT image panel reproduced with permission from REF42.
