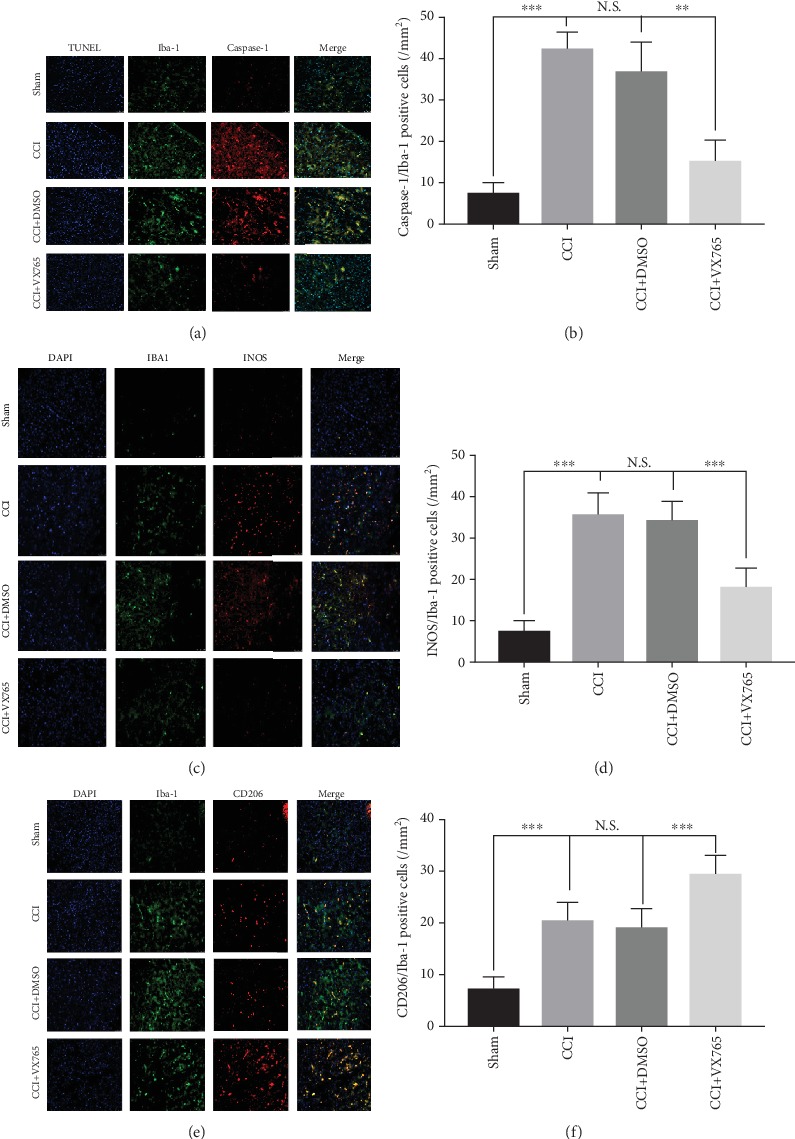
Figure 7.

Microglial alterations after trauma. (a) Representative photographs of double immunofluorescence staining for Iba-1 (green), caspase-1 (red), and TUNEL (blue) in the pericontusional cortex at 24 h postinjury. (b) Statistical analysis of immunofluorescence-positive cells. Note that the levels of Iba-1 and caspase-1 in the VX765 group were lower than those in the CCI and DMSO groups. (c–f) Fluorescence expression and proportion of M1 and M2 microglia in the area around the brain injury. (c) Colabeled fluorescent images and (d) proportional statistics of microglia Iba-1 (green) and iNOS (red). Compared with the sham operation group, M1-type microglia (Iba-1 and iNOS double-positive cells) were significantly elevated in the CCI and DMSO groups, and the M1-type microglia decreased significantly in the VX765 group. (e) Colabeled fluorescent images and (f) proportional statistics of microglia Iba-1 (green) and CD206 (red). Compared with the sham operation group, M2-type microglia (Iba-1 and CD206 double-positive cells) slightly increased in the CCI and DMSO groups, and M2-type microglia increased significantly in the VX765 group. Scale bars: 50 μm. n = 3. Data are presented as the mean ± SD. ∗∗∗P < 0.001. N.S.: not significant.
