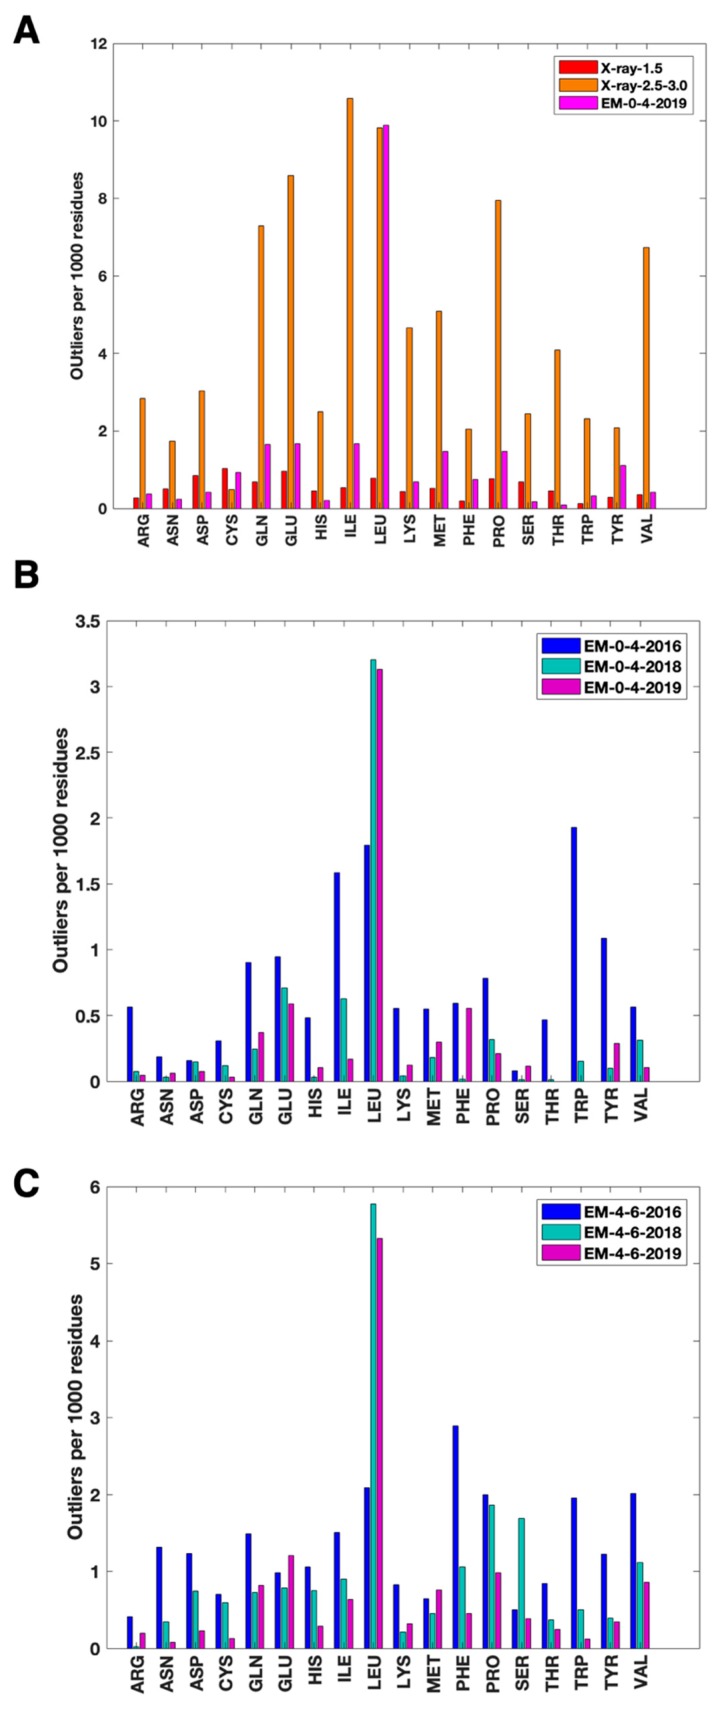
Figure 2.
HBOS outliers of various residue types. (A) The number of outlier residues with HBOS greater than 10 per 1000 same type of residues in X-ray-1.5 (red), X-ray-2.5–3.0 (orange), and EM-0-4-2019 (magenta). (B) The number of HBOS outlier residues (with HBOS greater than 10) that are labeled green in wwPDB validation reports per 1000 same type of residues in EM-0-4-2016 (blue), EM-0-4-2018 (cyan), and EM-0-4-2019 (magenta); (C) Similar information as in (B) for three different datasets: EM-4-6-2016 (blue), EM-4-6-2018 (cyan), EM-4-6-2019 (magenta).

