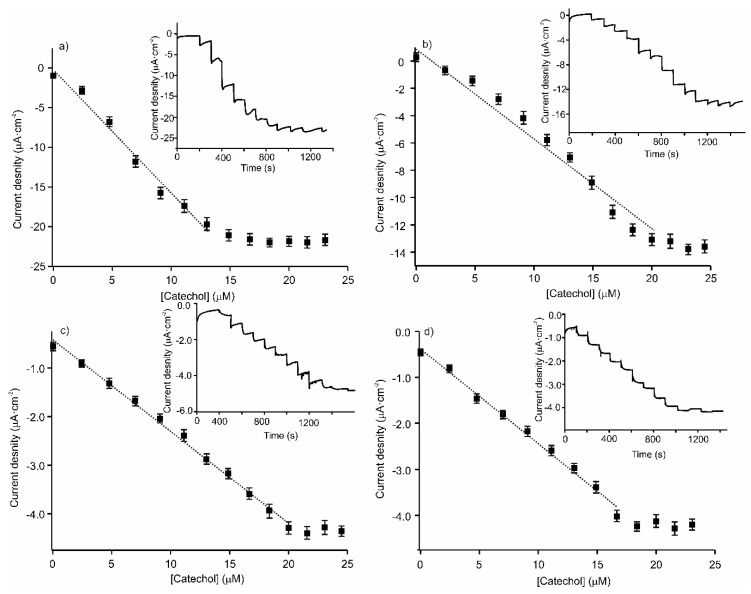
Figure 5.
Calibration curves of the amperometric response for increasing the concentration of catechol at (a) [(CHI)-(CuPcS)-(CHI)-(AuNPs)]2-Tyr; (b) [(CHI)-(AuNPs)-(CHI)-(CuPcS)]2-Tyr; (c) [(CHI)-(CuPcS)-(CHI)-(AuNPs)]2-Lac; and (d) [(CHI)-(AuNPs)-(CHI)-(CuPcS)]2-Lac. The insets show the amperometric responses obtained for each biosensor.

