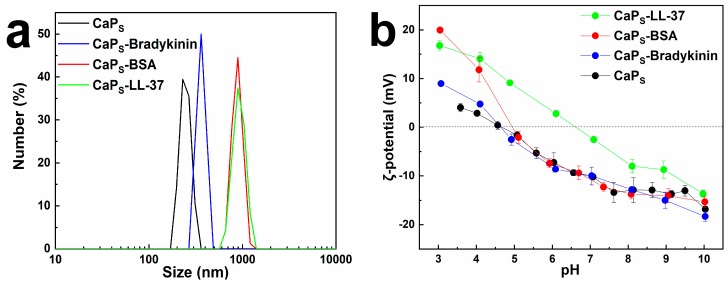
Figure 5.
(a) Size distribution of CaPS nanoparticles (number % data) before and after loading with BSA, bradykinin and LL-37 in phosphate-buffered saline (PBS) pH 7.4, as determined by dynamic light scattering (DLS) measurements (particle concentration 100 μg/mL); (b) ζ-potential profile of CaPS and loaded CaPS particles as determined by titration at different pH (particle concentration 100 μg/mL).

