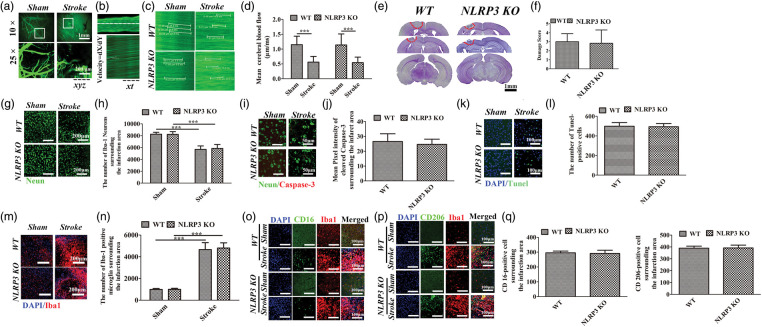
Figure 1.
Histological analysis of WT and NLRP3 KO mice following a single left photothrombotic stroke. (a) Imaging and XYZ scanning of cerebrovascular in cortex under two-photon microscope. (Above, 10 × , White box indicated the area zoomed in below, white dotted line indicated the occluded boundary; Below. 25 × , magnification field indicated in the above boxes). (b) xt scanning of target vessel using the two-photon imaging and equation to calculate the velocity. (c) Representative XT imaging in the sham and stroke animals. (d) Comparisons of blood flow between sham and stroke animals. (e) Nissl staining of coronal brain slices, red circle marks the damage area. (f) Comparisons of damage scores between WT and NLRP3 KO mice. (g–j) Immunofluorescence staining and comparison of Neurons and Cleaved caspase-3 between WT and NLRP3 KO mice surrounding the damage area. (k–l) TUNEL staining and comparison of Tunel-positive cells between WT and NLRP3 KO mice surrounding the damage area. (m–q) Immunofluorescence staining and comparisons of overall Iba-1-positive, CD-16 positive and CD-206 positive microglia in WT and NLRP3 KO mice surrounding the damage area. *P ≤ 0.05; **P ≤ 0.01; ***P ≤ 0.001. n = 6.

