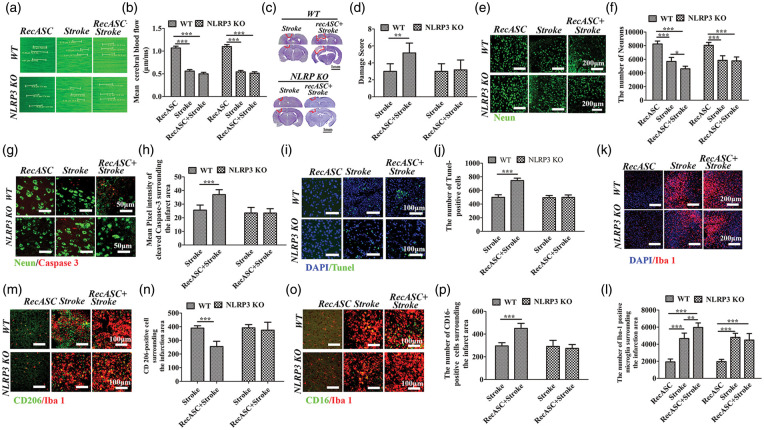
Figure 6.
Histological analysis of WT and NLRP3 KO mice following photothrombotic stroke with or without RecASC injection. (a) XY scanning of target vessels in the left cortex with RecASC injection or photothrombotic stroke. (b) Comparison of the velocities among the groups with RecASC injection, stroke and RecASC plus stroke. (c) Nissl staining of coronal brain slices; red circle marks the damage area. (d) Comparison of the damage score between the animals with stroke and animals with stroke plus recASC injection in WT and NLRP3 KO mice. (e–h) Immunofluorescence staining and comparisons of Neurons and Cleaved caspase-3 surrounding the damage area among the groups with RecASC injection, stroke and RecASC plus stroke, in WT animals and NLRP3 KO mice. (i–j) TUNEL staining and comparison of Tunel-positive cells surrounding the damage area among the groups with RecASC injection, stroke and RecASC plus stroke, in WT animals and NLRP3 KO mice. (k–p) Immunofluorescence staining and comparisons of the overall Iba-1-positive, CD206-positive and CD-16 positive microglia surrounding the damage area of the number of Iba-1-positive microglia among the animals with RecASC injection, animals with stroke and animals with stroke plus recASC injection in WT and NLRP3 KO mice. *P ≤ 0.05; **P ≤ 0.01; ***P ≤ 0.001. n = 6.

