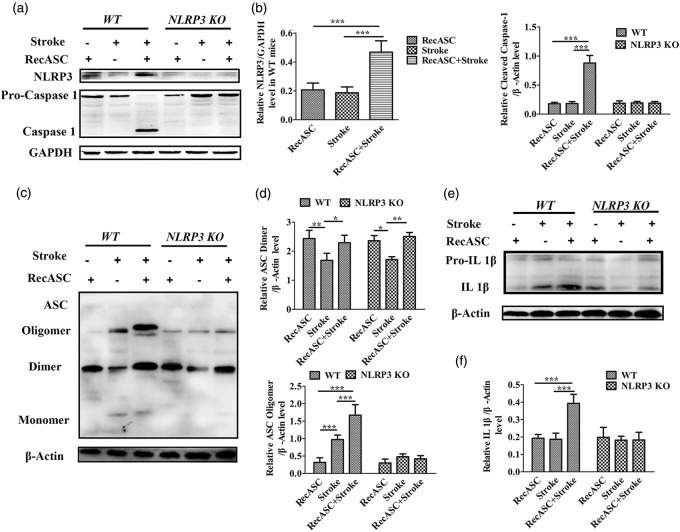
Figure 7.
Western blot analysis of WT and NLRP3 KO mice following photothrombotic stroke with or without recASC injection. (a) Chemiluminescence imaging of NLRP3 and Caspase-1 as well as GAPDH surrounding the stroke area. (b) Comparison of the relative level of NLRP3, cleaved Caspase-1 between the WT and NLRP3 KO mice following RecASC injection, stroke and RecASC injection plus stroke. (c) Chemiluminescence imaging of ASC and β-actin surrounding the stroke area. (d) Comparison of the relative level of ASC dimer and oligomer between the WT and NLRP3 KO mice following RecASC injection, stroke and RecASC injection plus stroke. (e–f) Chemiluminescence imaging and comparison of IL 1-β surrounding the stroke area between the WT and NLRP3 KO mice following RecASC injection, stroke and RecASC injection plus stroke. *P ≤ 0.05; **P ≤ 0.01; ***P ≤ 0.001. n = 6.

