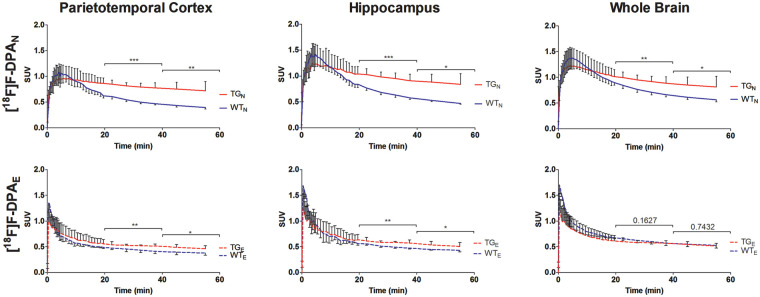
Figure 2.
Time–activity curves derived from the parietotemporal cortex, hippocampus and whole brain VOIs for TG and WT mice at 9 months obtained using [18F]F-DPAN and [18F]F-DPAE (n = 3 per group). * are used to denote the level of significance between WT and TG for SUVs averaged for the 20- to 40-min and 40- to 60-min time intervals (*P < 0.05,**P < 0.01, ***P < 0.001).

