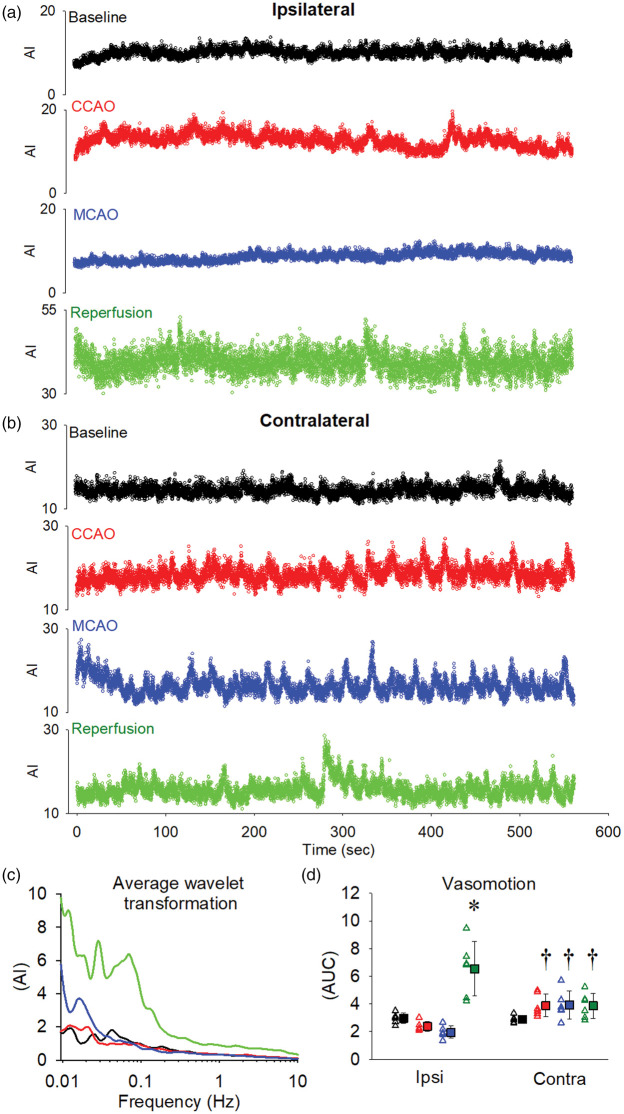
Figure 5.
Assessment of cortical vasomotion on both the ipsilateral (MCAO) and contralateral (no MCAO) hemispheres. A 9-min infusion was used to ensure steady-state microbubble concentrations prior to assessment of cerebral hemodynamics. Representative 9-min traces from a single experiment are shown from the ipsilateral cortex (a) and contralateral cortex (b) for baseline (black), CCAO (red), MCAO (blue) and reperfusion (green). Spectral analysis was performed on these data and a representative frequency distribution is shown for the ipsilateral cortex (c). Total vasomotion patterns were assessed for each experiment and the quantified data are shown in panel (d). Open triangles represent individual values from independent experiments and filled squares represent the means ± SD for six rats. Where error bars are not visible, they are within the symbol. *Denotes p < 0.05 vs. within group baseline, †denotes p < 0.05 vs. ipsilateral at the same time-point as assessed by repeated measures two-way ANOVA with SNK post hoc.

