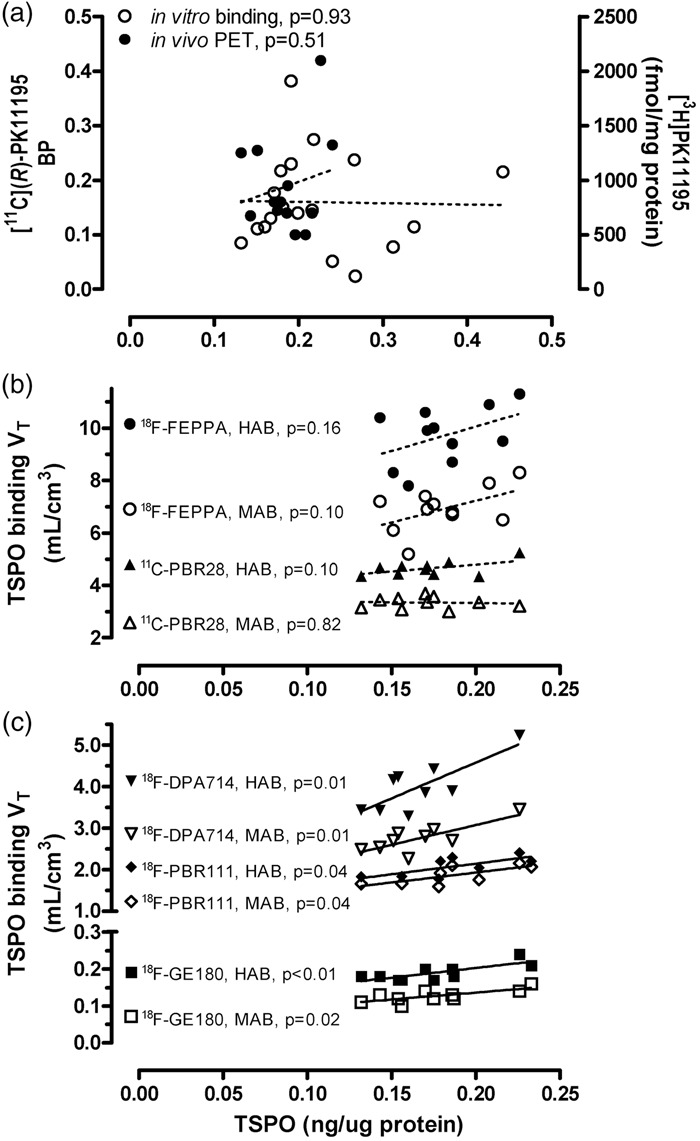
Figure 3.

Correlations (Pearson) between regional protein levels of TSPO determined in this study vs. outcome measures of binding reported in the literature (p < 0.05 for solid lines and p > 0.05 for dashed lines). To assess the correlation between TSPO protein vs. TSPO binding amongst different brain areas, the following regions were employed, with subregional averages when necessary: thalamus, midbrain, globus pallidus, hippocampus, amygdala, cerebral cortical areas (cingulate, insula, frontal, temporal, parietal and occipital cortices), cerebellar cortex, and striatum (caudate and putamen). (a) TSPO protein versus [3H]PK11195 binding density determined by autoradiography in autopsied human brain reported by Doble et al.38 and [11C](R)-PK11195 binding potential acquired by positron emission tomography (PET) reported by Cagnin et al.21 Note the lack of correlation between the regional distribution of TSPO protein in our autopsied human brain study vs. the regional distribution of binding of the first generation TSPO tracer, PK11195. (b, c) TSPO protein regional distribution in autopsied human brain versus PET total distribution volume (VT) of five second generation TSPO radiotracers that are influenced by the single nucleotide genetic polymorphism (rs6971, HAB-high affinity binder and MAB-mixed affinity binder), including [18F]-FEPPA reported by Atwells et al.,27 [11C]PBR28 reported by Rizzo et al.,23 [18F]DPA-714 reported by Lavisse et al.,30 [18F]PBR-111 reported by De Picker et al.,32 and [18F]GE-180 reported by Fan et al.34 Note that in contrast to the lack of correlation with the first generation ligand, there was positive (r = 0.72–0.79, p < 0.05) or a trend for a positive correlation (r = 0.45–0.55, p = 0.10–0.16) between the regional distribution of TSPO protein in autopsied brain vs. those of binding of the second generation tracers in PET imaging studies, with the exception of [11C]PBR28 in MAB (r = −0.09, p = 0.82).
