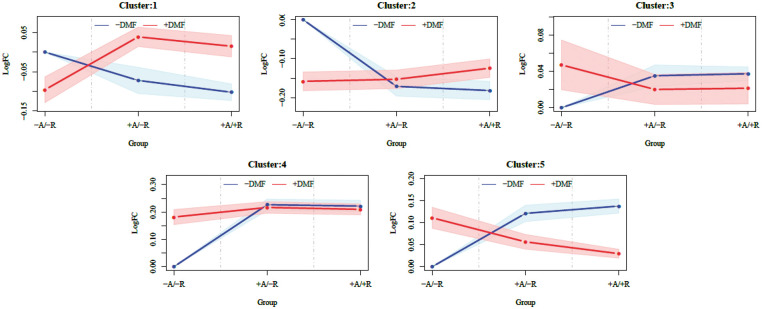
Figure 5.
Cluster profiles of differentially expressed proteins from Circle of Willis arteries in elastase aneurysm model mice either treated with DMF (red) or vehicle (blue). Five clusters were defined by a Bayesian infinite mixture model clustering algorithm [ref.]. Y-axis are log (base 10) fold-changes among mean intensity values (solid lines) ± CI 95% (shaded polygons) of clusters of differentially expressed proteins generated by mass spectrometry (LC-MS) assays of mice either with (+) or without (−) aneurysm formation (A) and rupture (R) either treated with DMF (+DMF) or vehicle (−DMF) and mean intensity values of controls (−A/−R/−DMF).

