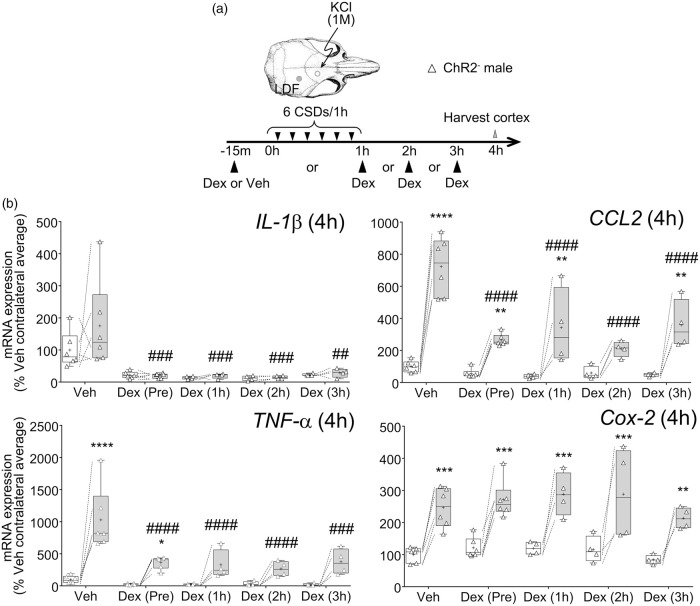
Figure 6.
Effect of dexamethasone post-treatment on cortical pro-inflammatory gene expression. (a) CSDs were induced by brief topical KCl application through thinned skull and monitored by laser Doppler flowmetry in male ChR2− mice. Six CSDs were induced over 1 h. Dexamethasone was administered pre or post-CSD (1, 2, or 3 h) after first CSD. Cortical tissue was harvested at 4 h after the first CSD. (b) IL-1β, CCL2, TNF-α, and Cox-2 mRNA expression 4 h after CSD. Values are expressed as % of average contralateral expression of vehicle group. Left (white) and right (gray) bars at each time point indicate contralateral and ipsilateral hemispheres, respectively (whiskers, full range; box, interquartile range; horizontal line, median; + , mean). Individual data points from each animal are also shown. Dashed lines show paired measurements (contralateral vs. ipsilateral) from the same brain. ** – **** p < 0.01–0.0001 vs. contralateral hemisphere, ## – #### p < 0.01–0.0001 vs. ipsilateral hemisphere of vehicle group (two-way ANOVA for repeated measures followed by Holm-Sidak's multiple comparisons test). Vehicle and dexamethasone (pre-CSD treatment) data for CCL2 and TNF-α are re-plotted from Figure 5 for side-by-side comparisons. LDF: laser Doppler flowmetry; CSD: cortical spreading depolarization; Cox-2: Cyclooxygenase-2; IL-1β: interleukin-1β; CCL2: chemokine (C-C motif) ligand 2; TNF-α: tumor necrosis factor-α.

